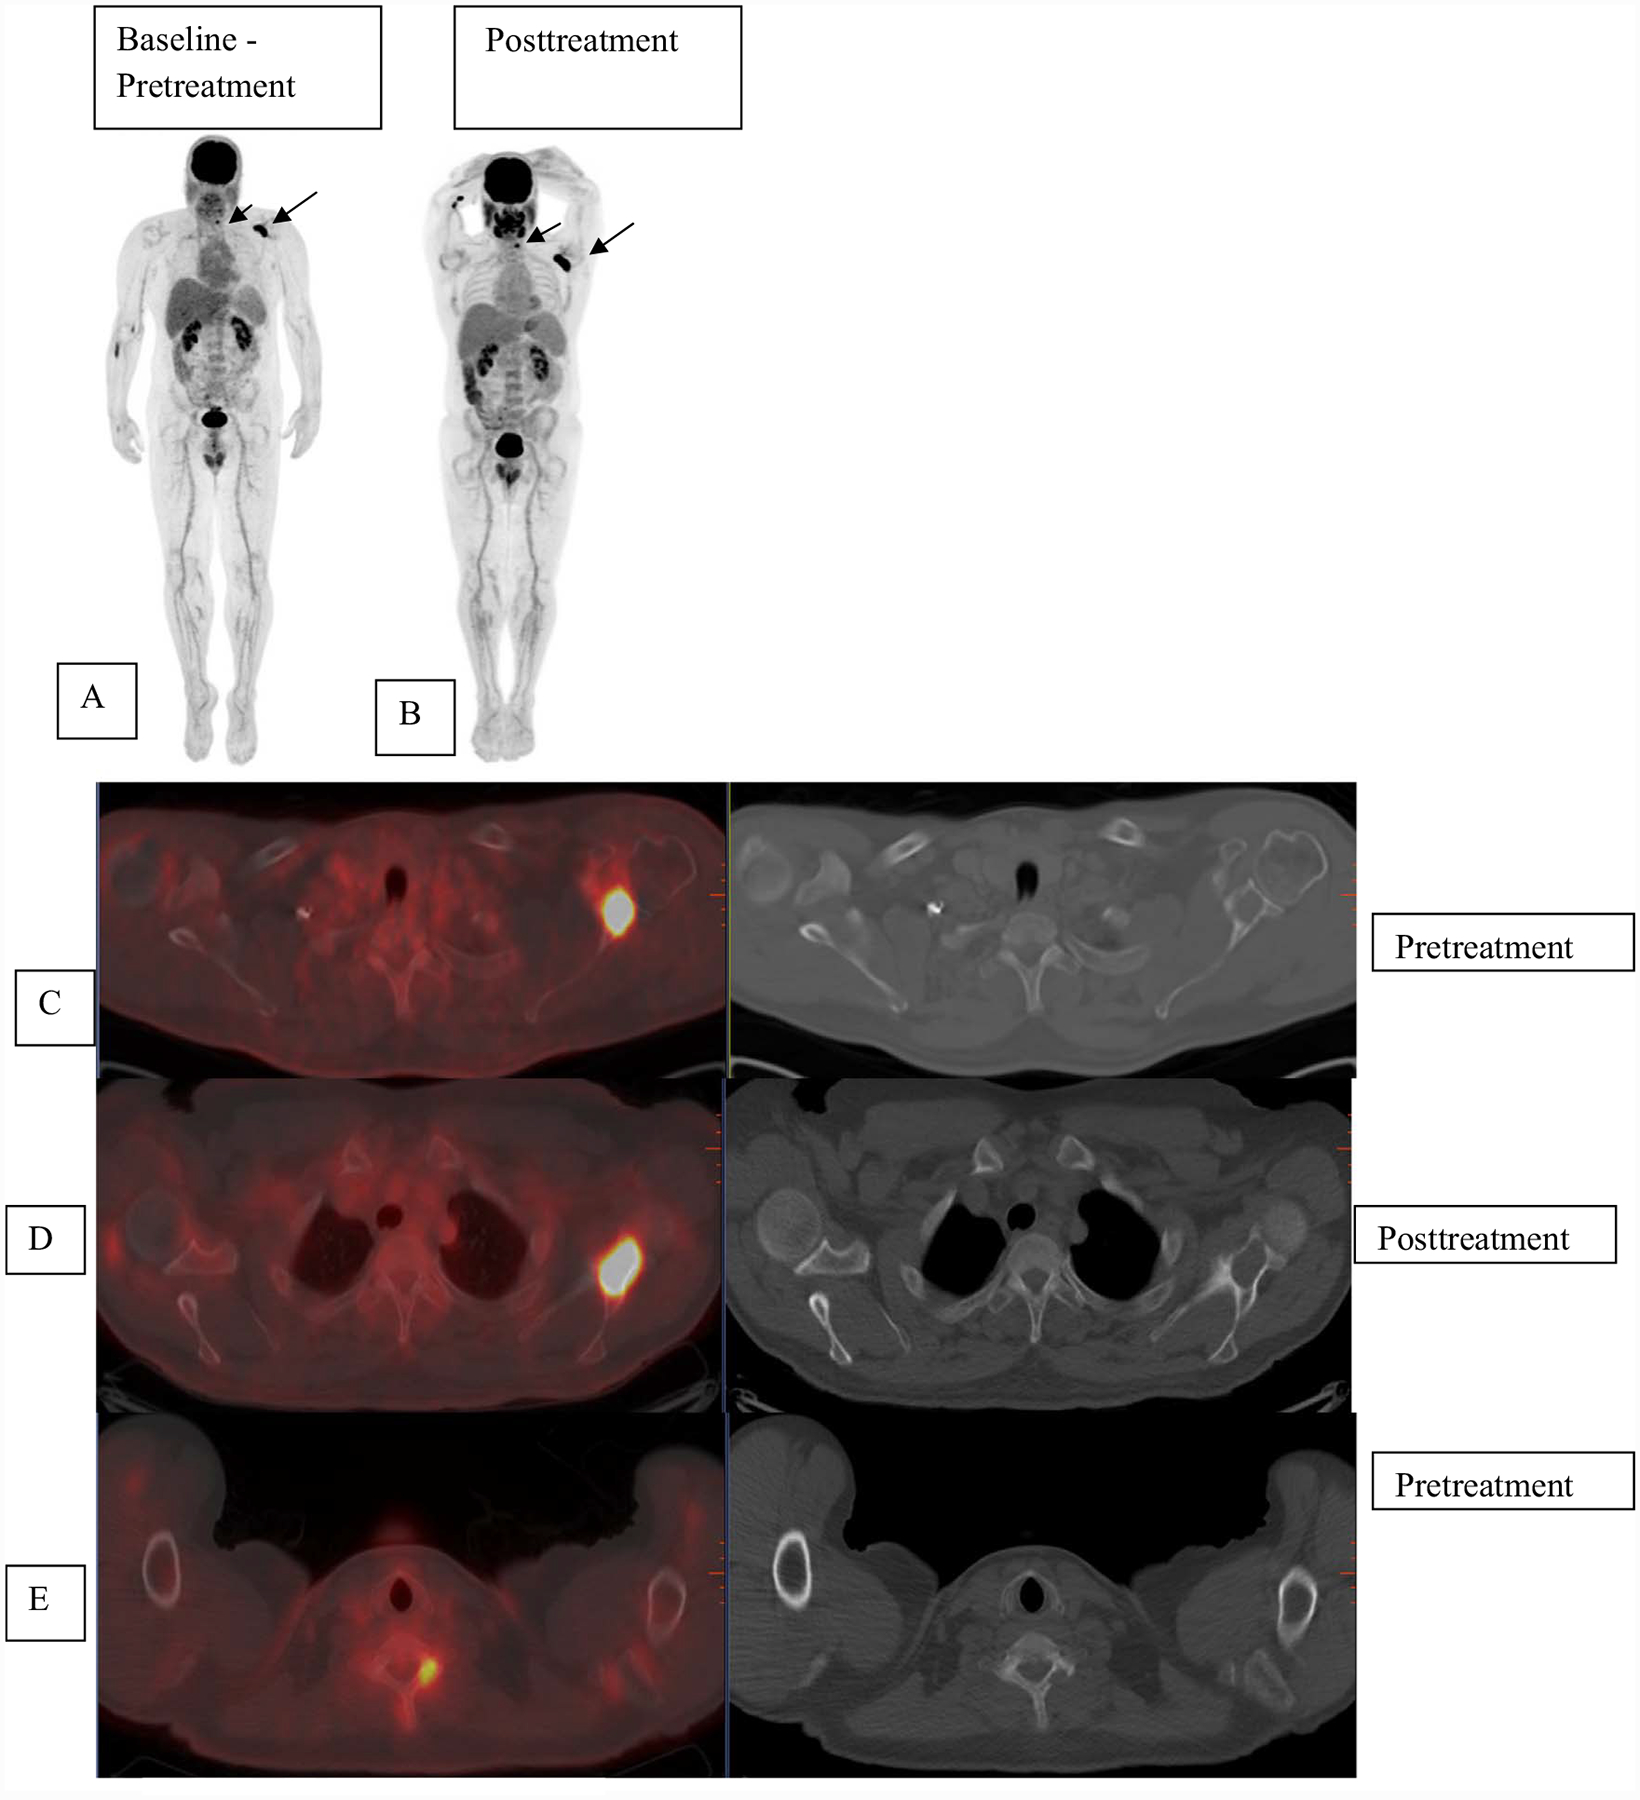
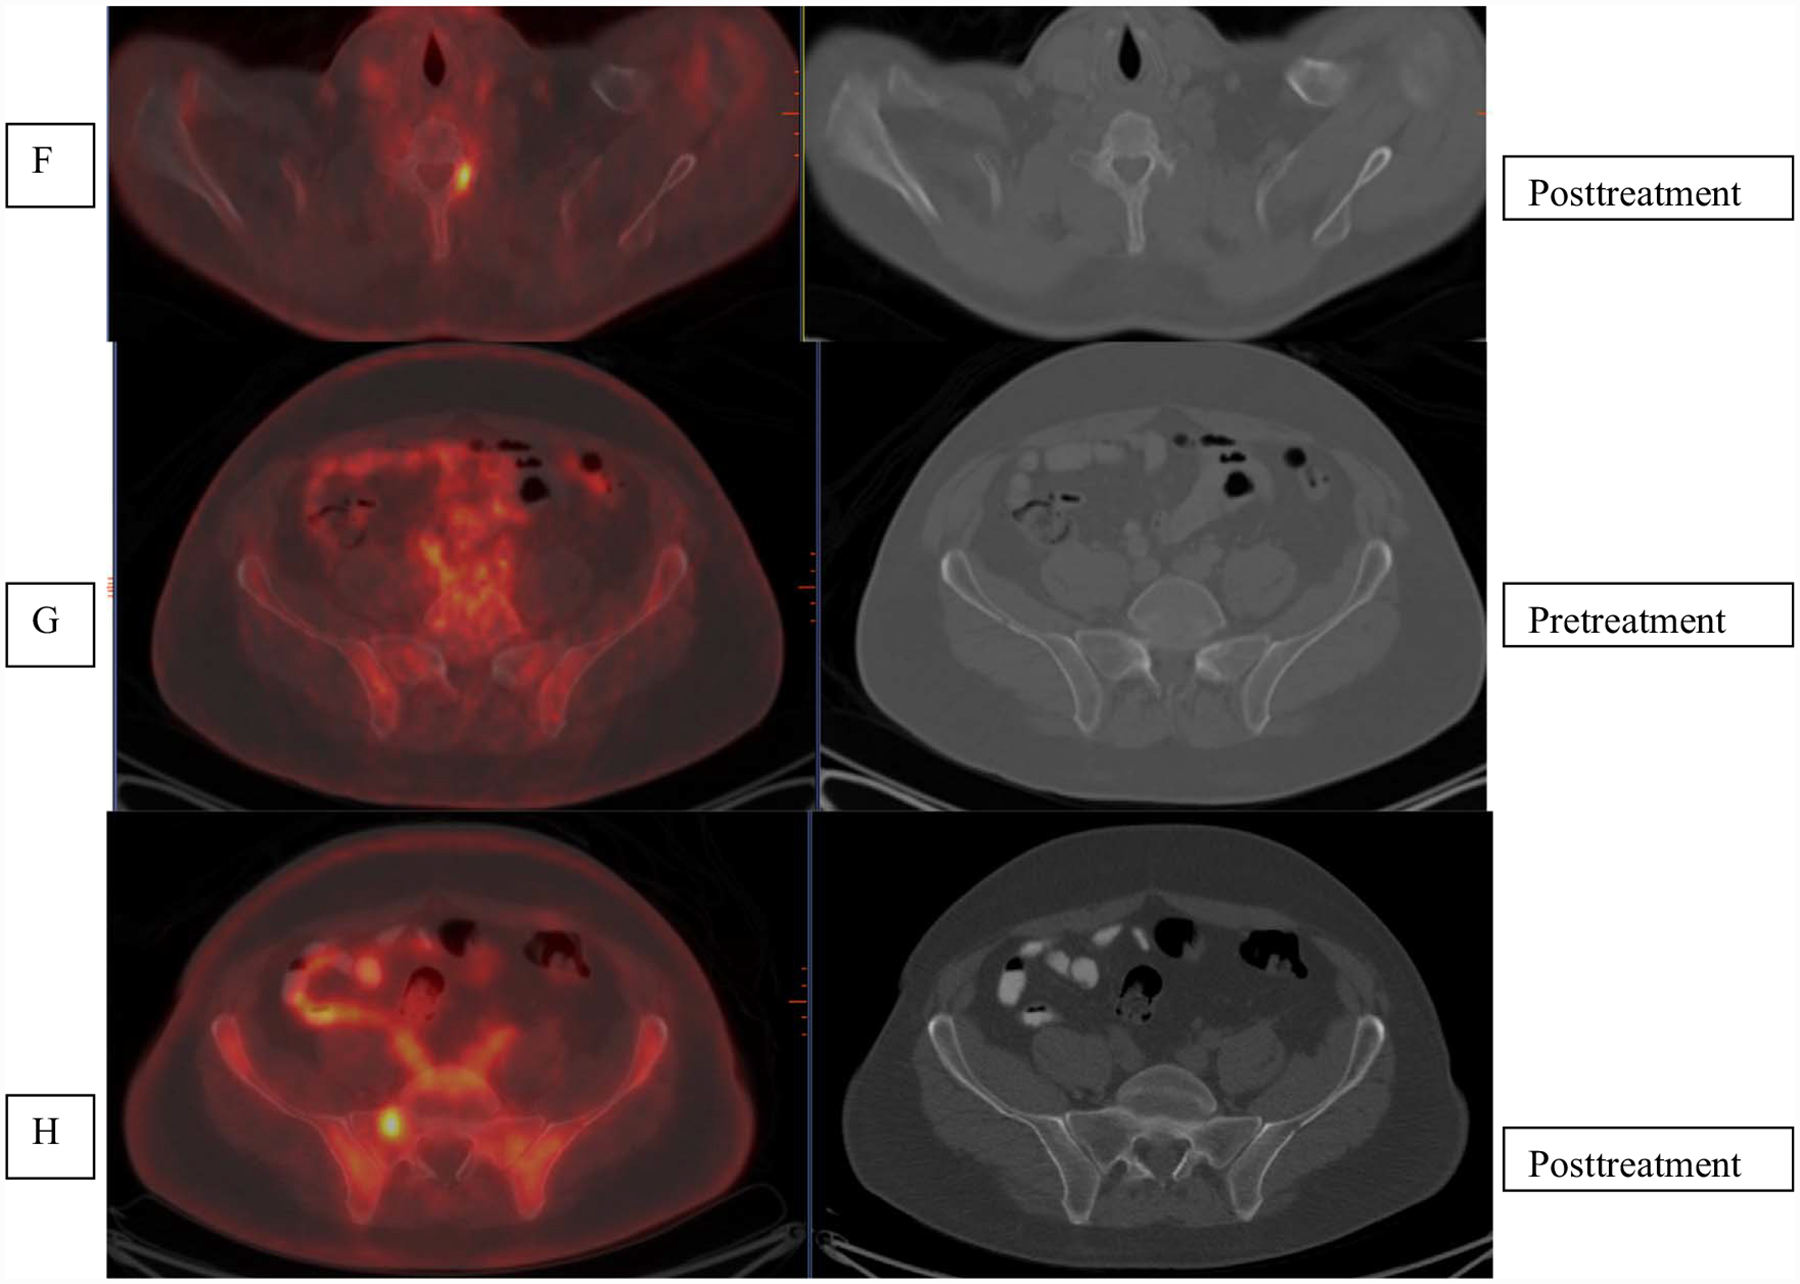
Fig. 4.


Patient with multiple myeloma was referred for evaluation with FDG-PET imaging. Pretherapy baseline scan (A) shows uptake in the left scapula SUV 16.1 (long arrow) and cervical vertebra (short arrow) that are also seen on fused images C, E localizing to lytic lesions on CT (arrows C and E). Post-therapy scan (B) shows increased extent of uptake in left scapula SUV 21 (D) and left cervical vertebra SUV 6.2 (F) as compared to prior. New uptake was seen in right sacrum (SUV 4.9), not visualized as compared to prior. SUV = standardized uptake values.
