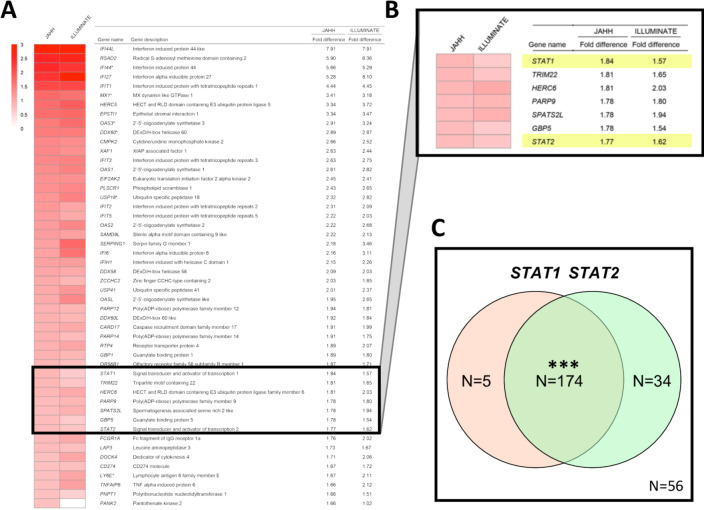
Figure 1.
(A) The top 50 genes upregulated (ranked from high to low) based on the difference in expression between patients with SLE) from JAHH and healthy control subjects are shown. Gene names were obtained from the MetaBase (Clarivate) database. Findings were compared with those from the ILLUMINATE study, analysed using data deposited in the NCBI Geo database (GSE88887), where an independent group of controls was compared with ILLUMINATE patients with SLE at baseline and expression fold differences are shown. Results shown for patients with SLE from JAHH compared with healthy controls had q-values <2.7×10⁻⁸. (B) Exploded heatmap showing the top 36th to 42nd top DE genes, which included STAT1 and STAT2. (C) Coordinated mRNA overexpression of signal transducer and activator of transcription (STAT) 1 and STAT2 in patients with SLE. Patients were assigned to the STAT1 high and the STAT2 high groups if their STAT1 and STAT2 mRNA expression at baseline was higher than the 95th percentile of healthy controls. The number of patients in the STAT1 high (orange circle) and STAT2 high (green circle) groups are indicated in the Venn diagram. A total number of 56 patients had normal expression of both STAT1 and STAT2. A total of five patients showed high expression of STAT1 but not STAT2, while 34 patients had increased STAT2 and normal STAT1 expression. A total of 174 patients had increased expression of both STAT1 and STAT2. Asterisks indicate statistically significant association (***= p<0.001). DE, differentially expressed.

