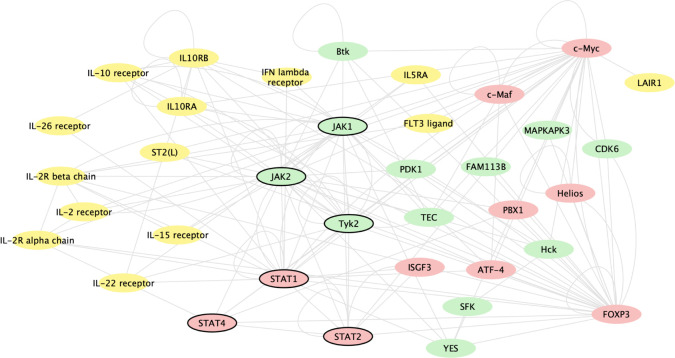
Figure 3.
Gene network analysis of genes changed based on baricitinib’s inhibition of JAK1 and JAK2 signalling and the most significantly baricitinib-induced changed genes, regardless of mechanism. The analysis includes genes changed with baricitinib 4 mg at week 12 compared with placebo. The genes included were identified by two methods: (1) the 50 genes most significantly changed with baricitinib treatment and (2) genes that interact with JAK1 or JAK2 via transcriptional regulation or phosphorylation as defined by the curated MetaBase (Calarivate) database and had an adjusted p<0.05. In order to graphically show the interactions, these genes, along with STAT1, STAT2, JAK1, JAK2 and Tyk2, were queried against the known interactions in MetaBase and kinases (green), ligands/receptors (yellow) and transcription factors (red) with known interactions were connected and displayed using cytoscape (cytoscape.org); genes that were not directly connected to this network or were in other categories are not shown. Genes of key interest in the network are indicated by bold outline, including STAT1, STAT2, STAT4, JAK1, JAK2 and Tyk2. JAK, Janus kinase.

