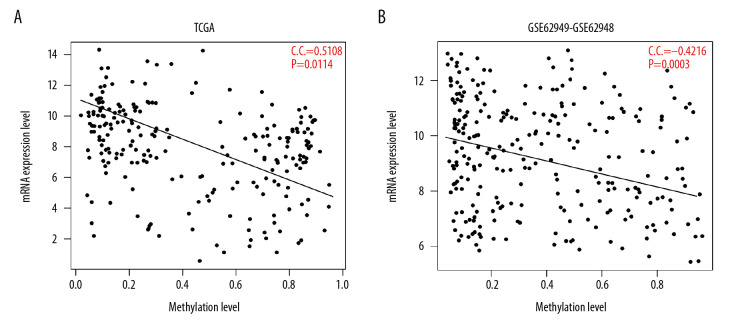
Figure 3.
Correlation analysis of expression levels and methylation levels of 265 genes in (A) TCGA and (B) the GSE62950 dataset. The horizontal axis represents the gene expression level, the vertical axis represents the gene methylation level, the oblique line represents the trend line synthesized by points, and the red font represents the correlation coefficient (CC) and the significant P value.

