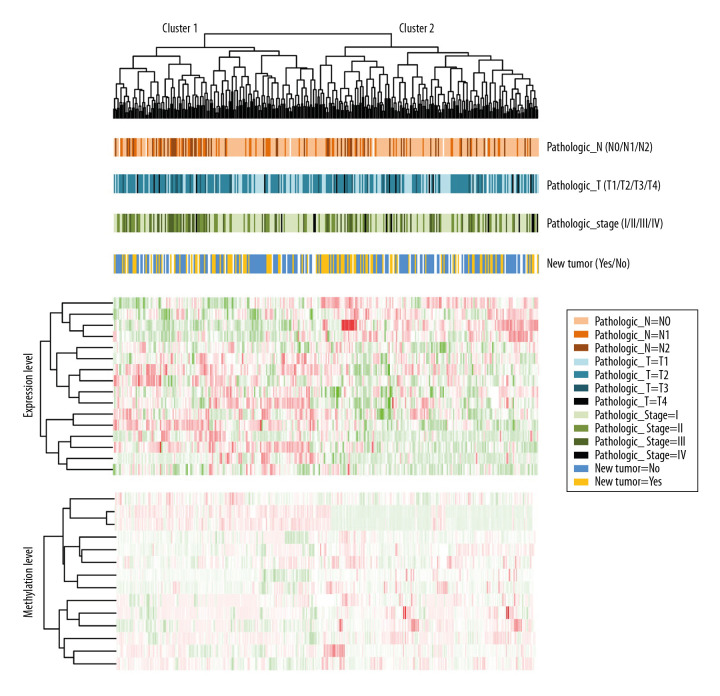
Figure 4.
Bidirectional hierarchical cluster heatmaps based on 16 gene expression and methylation levels. The first line under the cluster tree represents pathologic N information, and the change from light orange to deep orange represents N0 to N2. The second line represents the pathologic T information, and the change from light blue to dark blue represents T1 to T4. The third line represents pathologic stage information, and the change from light green to dark green represents stages I to IV. The fourth line represents new tumor information, and the blue and gold represent the samples without and with new tumor, respectively.

