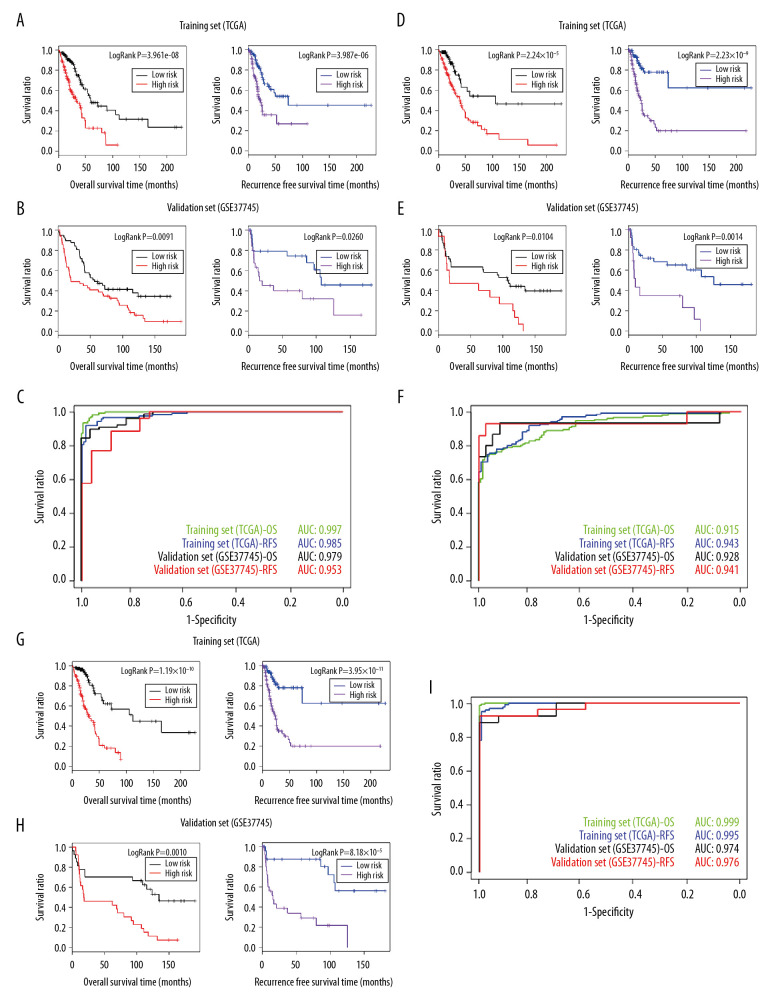
Figure 5.
(A) The Kaplan-Meier curves for the risk prediction model based on tumor marker genes and OS prognosis (left) and recurrence prognosis (right) in TCGA training set. (B) The Kaplan-Meier curves for the risk prediction model based on tumor marker genes and OS prognosis (left) and recurrence prognosis (right) in the GSE37745 validation set. (C) AUROC curves for the prognosis prediction model and OS prognosis and recurrence prognosis in TCGA training set and the GSE37745 verification set. (D) The Kaplan-Meier curves for the risk prediction model based on clinical factors and OS prognosis (left) and recurrence prognosis (right) in TCGA training set. (E) The Kaplan-Meier curves for the risk prediction model based on clinical factors and OS prognosis (left) and recurrence prognosis (right) in the GSE37745 validation set. (F) The AUROC curves for the prognosis prediction model and OS prognosis and recurrence prognosis in TCGA training set and the GSE37745 verification set. (G) The Kaplan-Meier curves for the risk prediction model based on tumor marker genes combined with clinical factors and OS prognosis (left) and recurrence prognosis (right) in TCGA training set. (H) The Kaplan-Meier curves for the risk prediction model based on tumor marker genes combined with clinical factors and OS prognosis (left) and recurrence prognosis (right) in the GSE37745 validation set. (I) The AUROC curves for the prognosis prediction model and OS prognosis and recurrence prognosis in TCGA training set and the GSE37745 verification set. The green and blue curves in (C, F, I) represent the AUROC curves for OS prognosis and recurrence prognosis in TCGA and the black and red curves represent the AUROC curves of OS prognosis and recurrence prognosis in the GSE37745 verification set.

