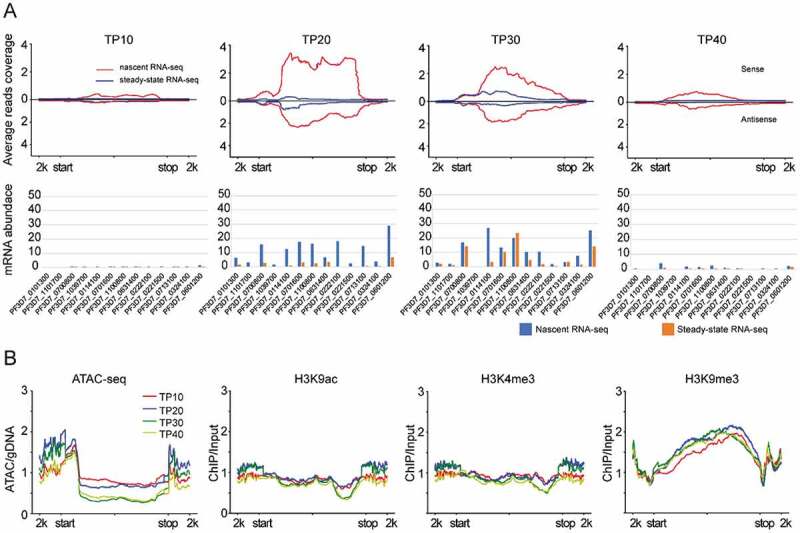
Figure 4.

Transcriptional profile and epigenetic state of Pfmc-2tm genes. (A) nascent RNA and steady-state RNA transcription profiles at four time points (line plots) and expression values (bar plots). (B) the chromatin state (ATAC-seq, H3K9ac, H3K4me3 and H3K9me3) of Pfmc-2tm genes at each time points. All reads coverage in line plots were normalized by RPKM. The gene features are −2kb upstream of gene start (start) and +2kb downstream of gene stop (stop).
