Figure 1.

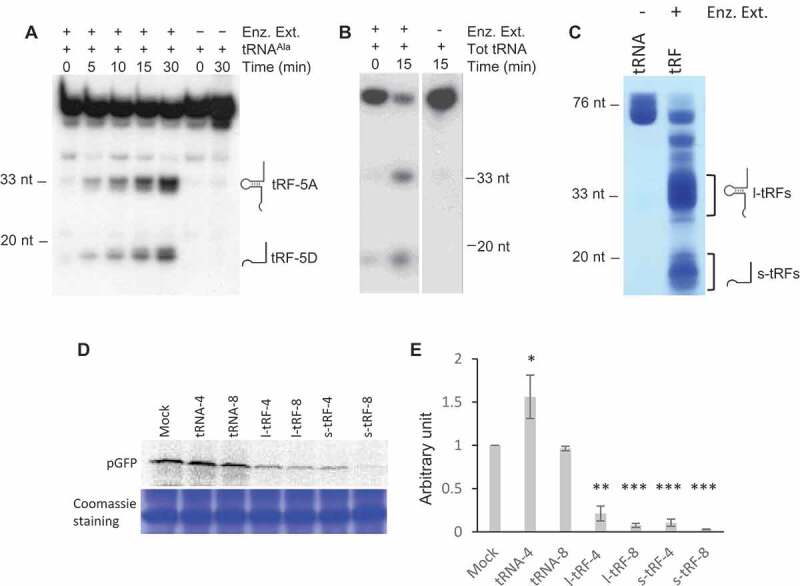
A. thaliana l- or s-tRFs can inhibit translation in vitro. (A) Kinetics of cleavage of Arabidopsis in vitro synthesized tRNAAla(UGC) transcript upon incubation in the presence (+) or absence (-) of a crude enzymatic extract from Arabidopsis leaves (Enz. Ex.). After incubation, RNAs were phenol extracted and fractionated on 15% polyacrylamide gel, followed by northern blot analysis with a radiolabeled oligonucleotide specific for the 5ʹ extremity of cytosolic Arabidopsis tRNAAla. (B) Cleavage of Arabidopsis total tRNA (Tot RNA) upon incubation in the presence (+) or absence (-) of a crude enzymatic extract from Arabidopsis leaves (Enz. Ex.). After incubation, RNAs were phenol extracted and fractionated on a 15% polyacrylamide gel, followed by northern blot analysis with a radiolabeled oligonucleotide specific for the 5ʹ extremity of cytosolic Arabidopsis tRNAAla. (C) Production of long (l-tRF) and short (s-tRF) tRFs by in vitro cleavage of total Arabidopsis tRNAs in the presence (+) of a crude enzymatic extract from Arabidopsis leaves (Enz. Ex.). After incubation, RNAs were phenol extracted, fractionated on 15% polyacrylamide gel and all l-tRFs and s-tRFs were purified separately from the gel. (D) Effect of the addition of total Arabidopsis tRNAs or tRFs purified in (B) on the synthesis of GFP in a wheat germ coupled transcription/translation system in the presence of 35S methionine. Radiolabeled GFP was detected by autoradiography or phosphor imaging after fractionation on 15% acrylamide gel. Two concentrations of tRNAs or tRFs were used: 4 µM (tRNA-4 and tRF-4) and 8 µM (tRNA-8 and tRF-8). Mock = control experiment without added tRNAs or tRFs. Coomassie blue staining of the gel is shown as a loading control. (E) Relative quantification of in vitro synthesized pGFP in experiments similar to that described in (D). Error bars show standard deviations (mean of three biological replicates). One-way ANOVA tests were used to calculate p-values. Asterisks indicate statistically significant differences between Mock and each treatment (***P< 0.001; **P< 0.01; *P< 0.1). A value of 1 has been given to the Mock sample.
