Figure 5.

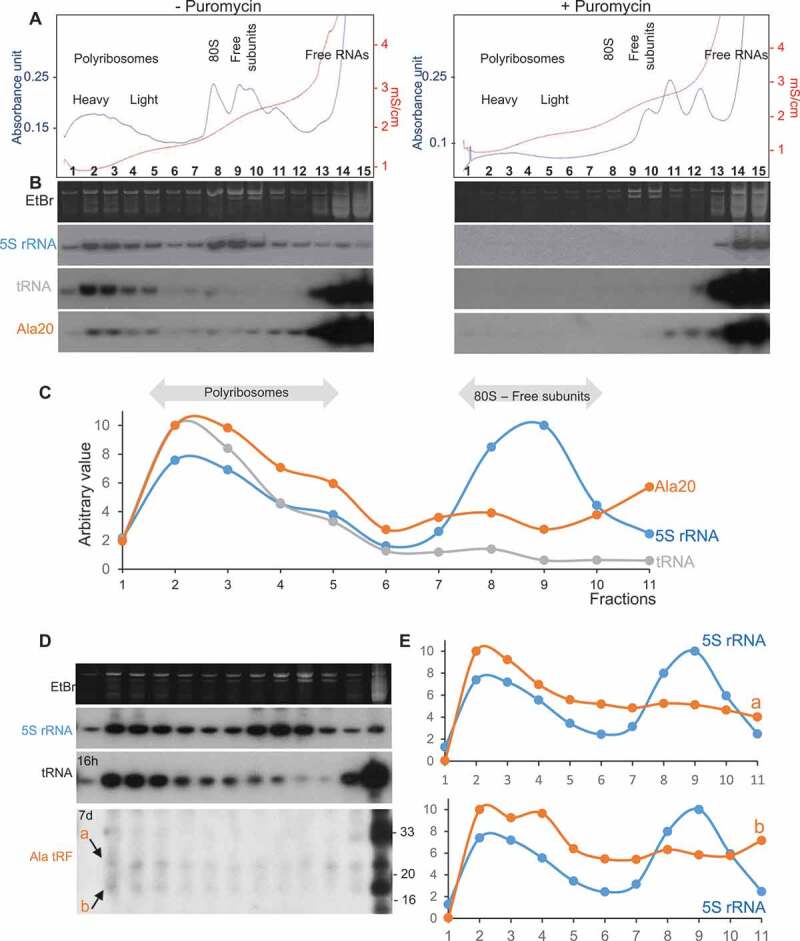
tRF-5D (Ala) associates with polyribosomes in vitro and in vivo. (A) Polyribosomes profile of Arabidopsis seedlings pre-incubated in vitro with Ala20 was determined using sucrose gradient sedimentation and OD254nm measurement (blue line) and conductivity (red line). Samples were treated or not with Puromycin. The positions of the heavy and light polyribosomes, 80S and ribosomal subunits and free RNAs are shown on the graphs. (B) RNAs extracted from each fraction shown in (A) were fractionated on 15% polyacrylamide gels and analysed by northern blots using probes specific for 5S rRNA, tRNAAla and tRF-5D (Ala). Ethidium bromide (EtBr) profiles are also shown. (C) Profiles obtained after quantification of the signals from the northern blots (5S rRNA in blue, tRNA in grey and tRF Ala20 in orange) performed with samples not treated with puromycin. Due to saturation of the free RNA fractions with the alanine probe, quantification was done only for fractions 1 to 11. An arbitrary value of 10 was given to the highest value obtained for each curve. Note that the intensity of the signals is not comparable from one curve to the other. In (D) a similar experiment was performed without adding any tRF to determine in vivo association of tRF-5D (Ala) with polyribosomes. The RNA fragments corresponding to the signals a and b are indicated by arrows. In (E) the profiles obtained after northern blots quantification with 5S rRNA probes (in blue) are compared to those obtained for a or b (in orange).
