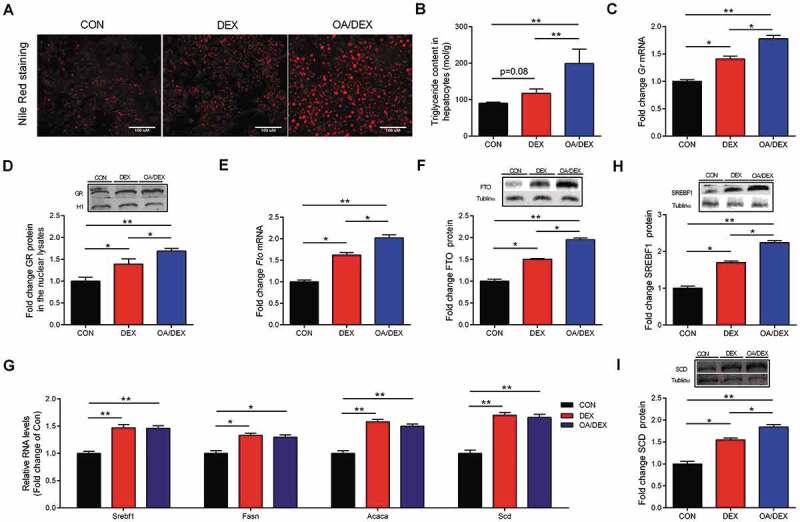
Figure 5.

Characterization of TG accumulation in primary chicken hepatocytes. (A) Primary hepatocytes stained with nile red, scale bar, 100 um. (B) TG content in in CON, DEX or OA/DEX treated hepatocytes. (C) Gr mRNA expression. (D) GR protein content in the nuclear lysates in CON, DEX or OA/DEX treated hepatocytes. (E) FTO mRNA and (F) protein expression in CON, DEX or OA/DEX treated hepatocytes. (G) The mRNA expression of Srebf1, Fasn, Acaca and Scd in CON, DEX or OA/DEX treated hepatocytes. (H-I) Protein content of SREBF1 and SCD in CON, DEX or OA/DEX treated hepatocytes. Tubulinα was used as a loading control. Values are means ± SEM, *P < 0.05, **P < 0.01 (n = 3).
