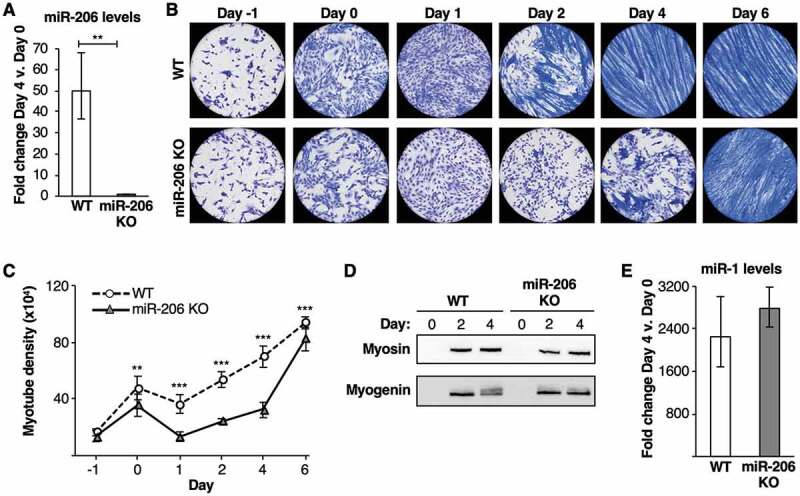
Figure 1.

A miR-206 knockout (KO) cell line shows a delay in myotube formation upon differentiation. (A) miR-206 expression does not increase in miR-206 KO cells incubated in differentiation media. Average fold change in miR-206 expression, normalized to control sno202 RNA levels, on Day 4 relative to Day 0 is plotted. The error bars denote the standard deviations (n = 3). ** indicates a p-value < 0.01, as determined from an unpaired two-tailed t-test. (B) miR-206 KO cells show a delay in myotube formation upon treatment with differentiation media compared to WT cells. Representative images of Jenner-Giemsa stained C2C12 WT and miR-206 KO cells during a time course of treatment with differentiation media are shown. Cells were switched to differentiation media on Day 0. (C) miR-206 KO cells show significantly less myotube density upon treatment with differentiation media compared to WT cells. Cells were switched to differentiation media on Day 0. Myotube density was calculated as the sum of pixels attributed to tones 0–75 at each time point [29]. The data are the average of twelve imaged regions from three biological replicates, and the error bars denote the standard deviations (n = 12). ** indicates a p-value < 0.01 and *** indicates a p-value < 0.001, as determined from an unpaired two-tailed t-test. (D) Myosin and myogenin proteins are expressed at similar levels in WT and miR-206 KO cells. Shown are Western blots before and after treatment with differentiation media. (E) miR-1 expression is induced to similar levels in WT and miR-206 KO cells after culturing in differentiation media. Average fold change in miR-1 expression, normalized to control sno202 RNA levels, on Day 4 relative to Day 0 is plotted; the error bars denote the standard deviation (n = 3).
