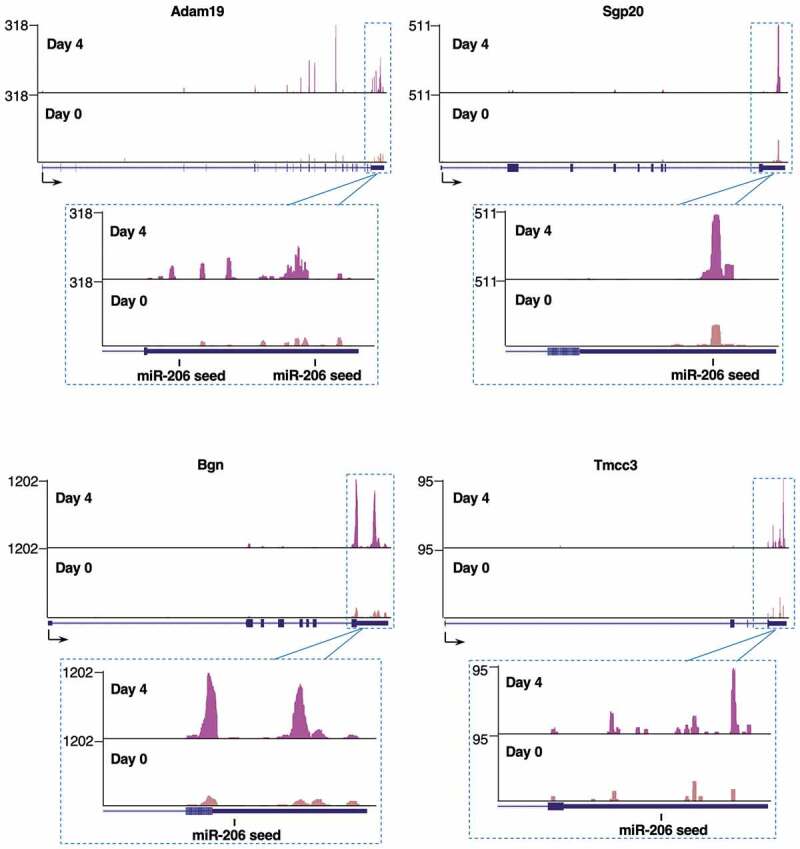
Figure 3.

Representative xOP-seq data for Adam19, Bgn, Spg20, and Tmcc3. Mapped reads from sequencing replicate 1 show enrichment in the 3ʹUTRs in the Day 4 compared to Day 0 data. The locations of miR-206 seed sequences are marked. Sequencing tracks were generated from the UCSC Genome Browser display of bedgraph files.
