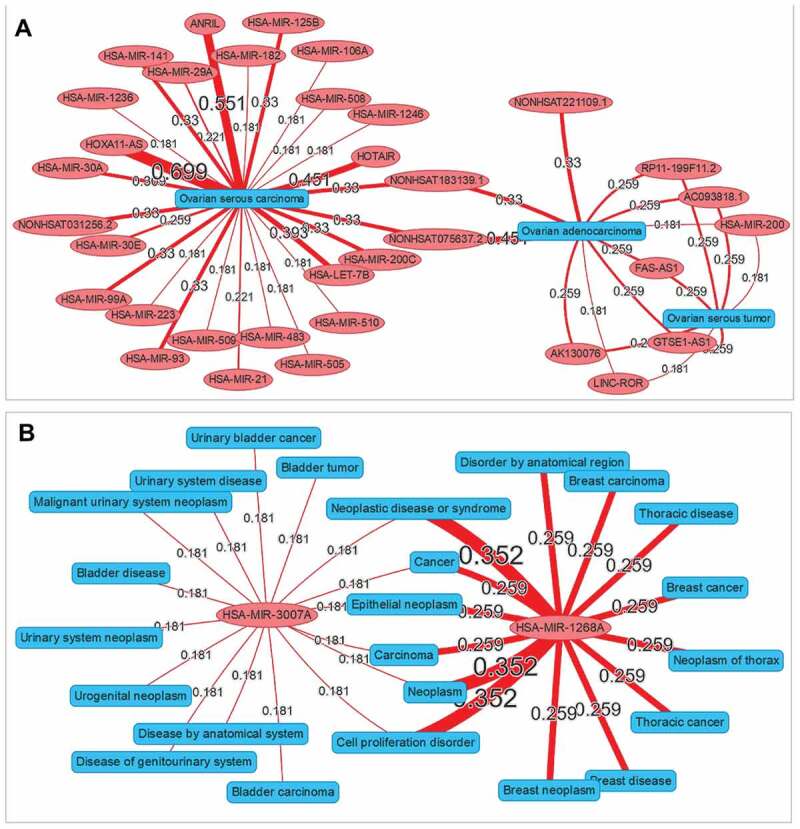
Figure 8.

The interaction network visualization. (A) An interaction network to explore the relationships among different subtypes of ovarian cancer and ncRNAs. (B) An interaction network to explore the relationships among different ncRNAs (hsa-mir-3007a and hsa-mir-1268a) and disease phenotypes. The values by the lines are the association scores between the ncRNAs and the disease phenotypes.
