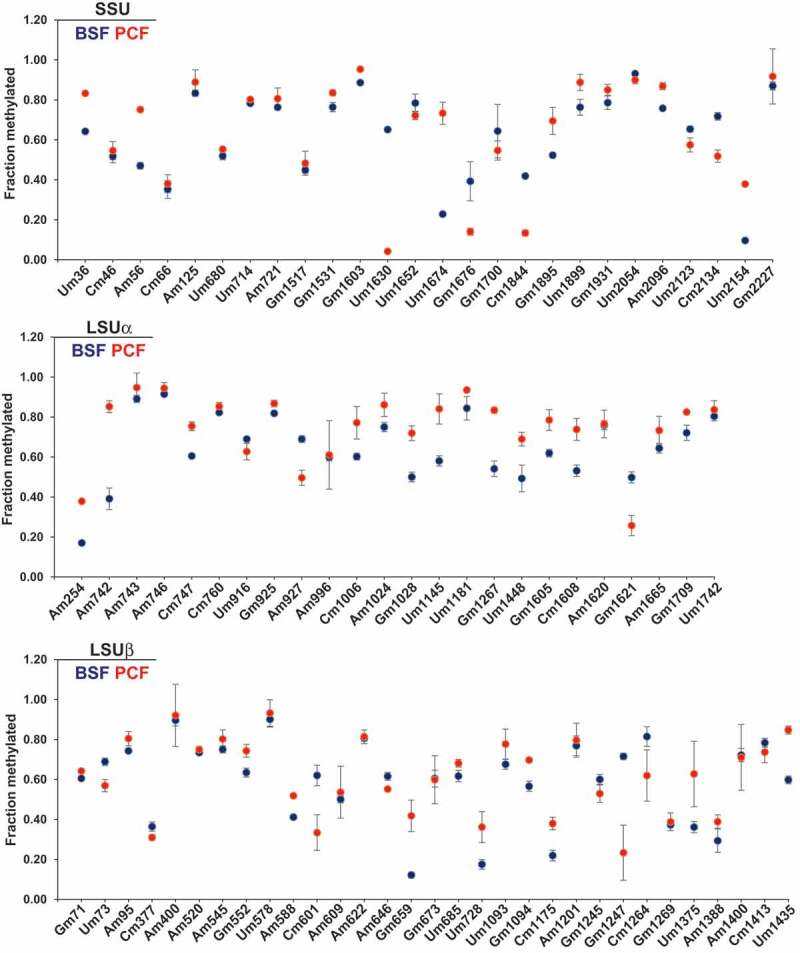
Figure 2.

RiboMeth-seq reveals the stoichiometry of methylation at Nm sites in T. brucei rRNA. RMS score for individual Nms on rRNA is plotted as the mean ± SE. Four biological replicates were used to quantify BSF Nms, and three replicates were used to quantify PCF Nms. The RMS score of BSF Nm is presented as blue dots and PCF as red dots. Sites adjacent to other Nms exhibiting low RMS scores are not shown.
