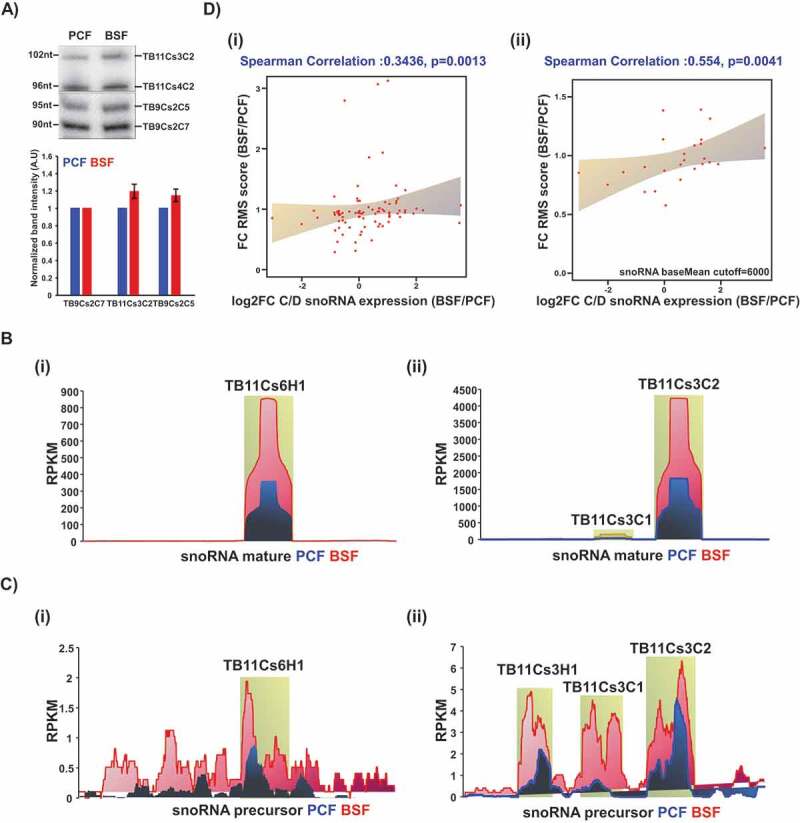
Figure 3.

snoRNA expression analysis. (A) Total RNA (10 μg) from PCF or BSF was separated on a 12% denaturing polyacrylamide gel and detected by northern blotting with complementary probes to the specified snoRNAs. Data are presented as mean ± S.E.M. Experiments were done in triplicate (n = 3). TB9Cs2C7 was used as loading control. (B) Coverage of selected snoRNA coding regions in T. brucei small RNome. The read distribution profile of the selected snoRNA coding sequence based on the PCF (blue) and BSF (red) small RNA libraries described in this study. (C) Coverage of selected snoRNA precursors. The read distribution profile of the snoRNA precursor sequence based on the PCF (blue) and BSF (red) libraries, as described in [45]. D) Correlation between Nm level and snoRNA expression. (I) Pairwise comparison of RMS score fold-change and snoRNA expression fold-change (log2) in both life stages from at least three independent libraries. Spearman’s correlation coefficient (R) and p-value are indicated. (ii) Pairwise comparison of RMS score fold change and snoRNA expression fold-change (log2) using a cut-off of baseMean >6000, in both life stages.
