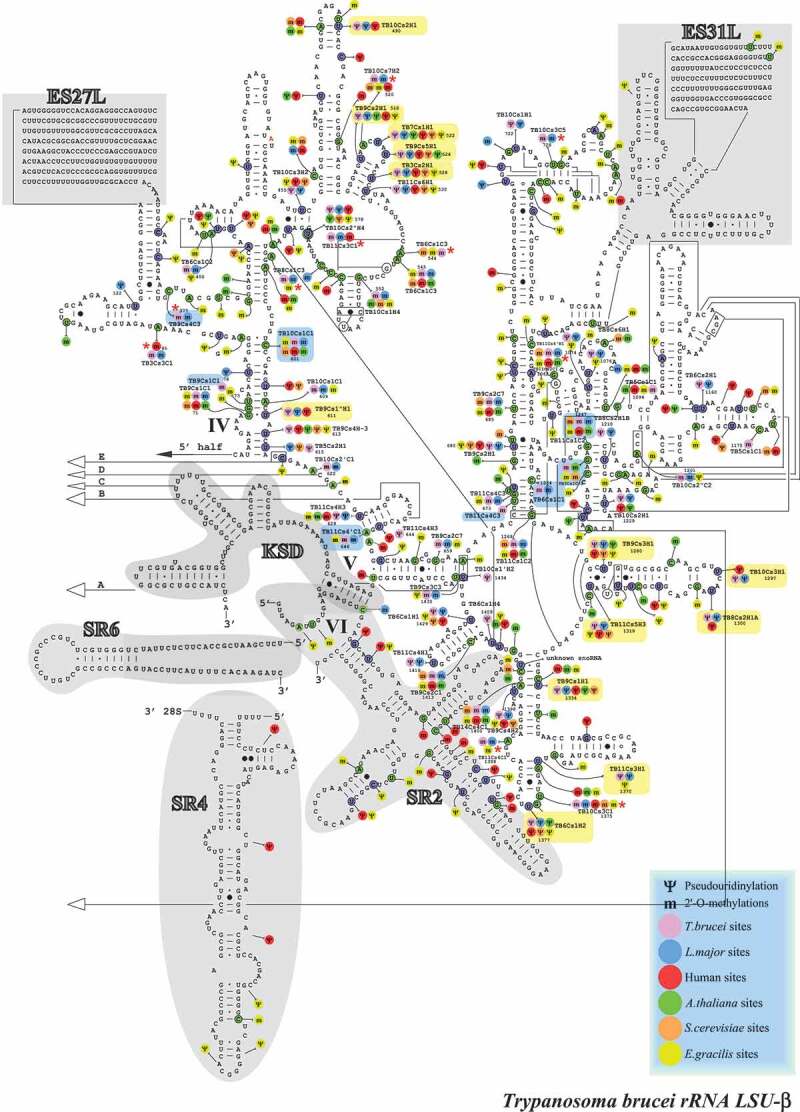
Figure 6.

Localization of Nms and ψs on the secondary structure of T. brucei LSUβ rRNA. Boxes highlighted in blue show the Nm sites whose level is increased in BSF (>10% compared to PCF) and those in yellow show the hypermodified pseudouridines (ψ) [20]. T. brucei specific Nm (not detected in T. cruzi or L. donovani Cryo-EM studies) are indicated by an asterisk (*).
