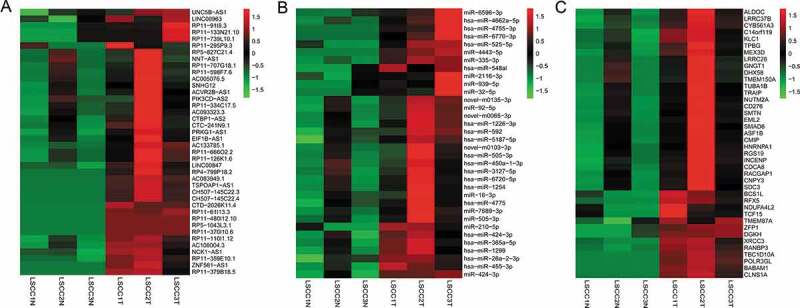
Figure 1.

Heat maps of differentially expressed lncRNA (A), mRNA (B) and miRNA (C) profiles. The heat maps describe the most significantly changed lncRNAs (top 40), mRNAs (top 40) and miRNAs (top 40) in 3 pairs of LSCC tissues compared with adjacent nontumor tissues, with fold change ≥1.5 for lncRNAs, fold change ≥2.0 for mRNAs and miRNAs, p < 0.05 and FDR < 0.05. The expression values are depicted in accordance with the colour scale. The intensity increases from green to red. LSCC: laryngeal squamous cell carcinoma; T: tumour tissues. N: adjacent nontumor tissues.
