
Figure 1.
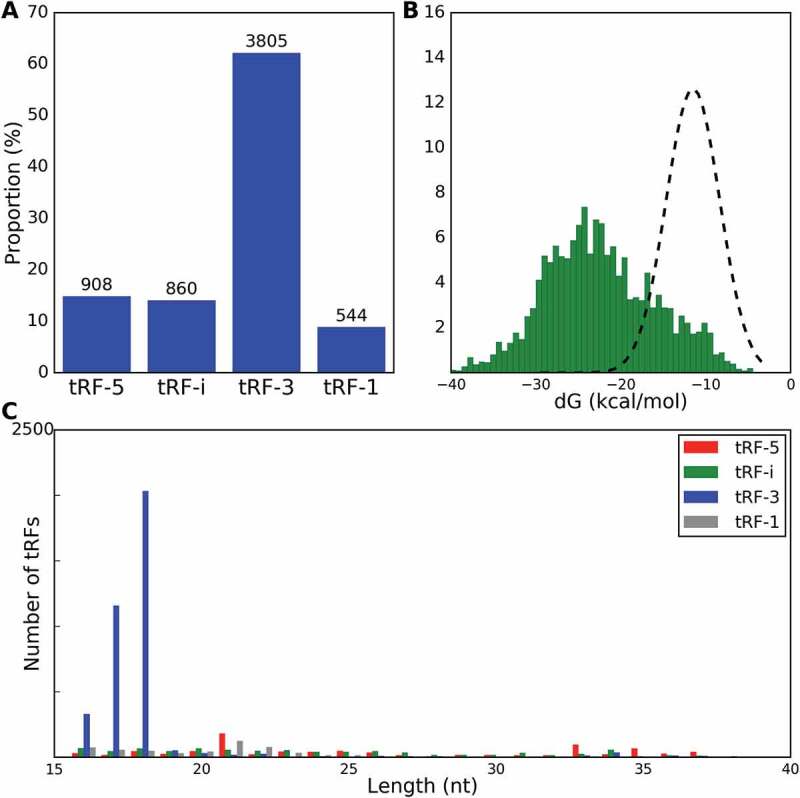
Ago-1 loaded tRFs. A) Distribution of guide tRF types identified from CLASH RNA chimeras (%% on the y-axis and actual counts of unique chimeras containing specific tRF types given above the histogram bars). B) Minimum Free Energy (MFE) histogram for tRF/target RNA chimeras (green histogram) and for randomly generated control interactions (black line). C) tRF length distribution in chimeras identified from CLASH data.