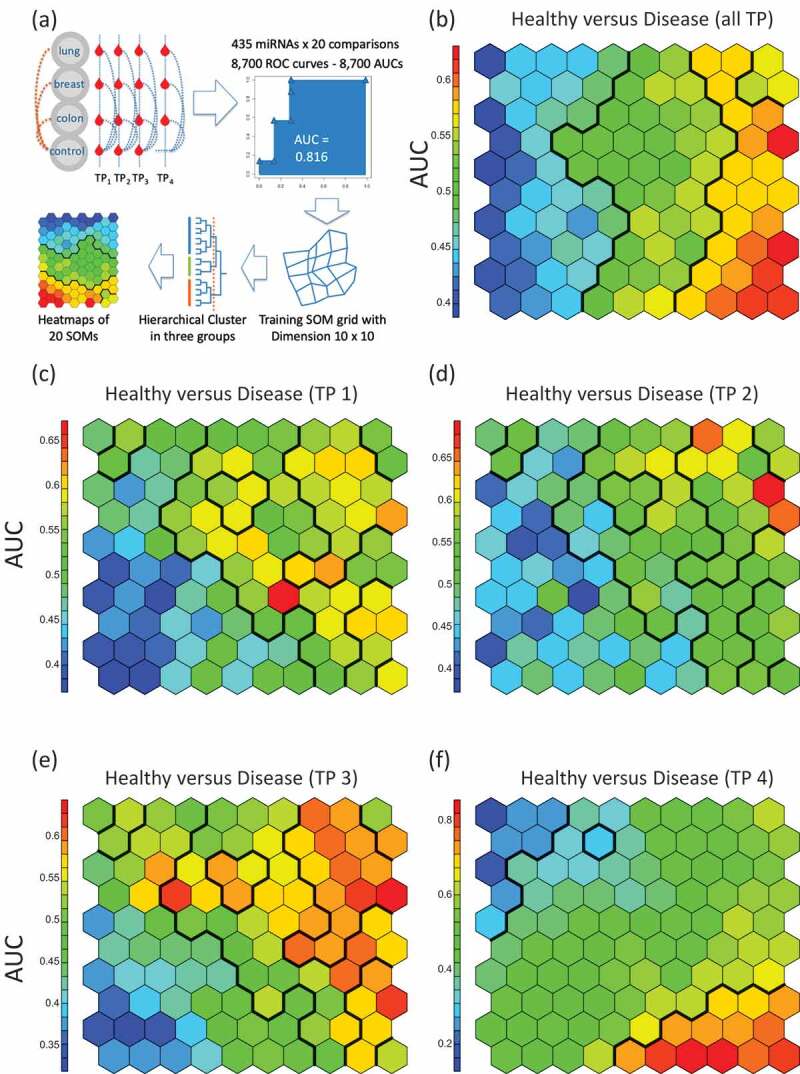
Figure 3.

Self-organized maps (SOMs) analysis.(A) Schematic representation of the workflow. We performed all pair-wise comparisons for tumours and matched samples as well as TP4 and all controls per cancer type (blue dotted lines) and for all cancer types together (orange dotted lines). The SOMs were trained with AUC data from all 20 comparisons. For the analysis groups, clusters were determined by using hierarchical clustering and heat maps were generated. In the heat maps, hexagons represents at least one but usually a set of miRNAs. The colorof a hexagon represents the AUC values of the miRNAs in that hexagonwith the colour code indicated to the left of each subfigure. (B) SOM for the comparison between all samples of the cancer patients and all control samples. Hierarchical clustering identified vertical sections indicating three clusters of differentially expressed miRNAs. (C) SOM for the comparison between of all samples collected at the first time point prior to cancer diagnosis as compared to matched controls. There is a cluster of miRNAs with lower expression in the pre-diagnostic cancer samples (indicated in blue in the lower left corner). (D) SOM for the comparison between all samples collected at the second time point prior to cancer diagnosis as compared to matched controls. The cluster of miRNAs with lower expression in pre-diagnostic cancer samples is less evident than for the first time point. (E) SOM for the comparison between all samples collected at the third time point prior to cancer diagnosis as compared to matched controls. There is again a cluster of miRNAs with lower expression but also a cluster with higher expression in pre-diagnostic cancer samples. (F)SOM for the comparison between all samples collected after cancer diagnosis as compared to combined controls (healthy controls). The upper left corner describes a cluster of miRNAs with lower expression while the lower right corner represents a cluster with higher expression in post-diagnostic cancer samples. The overall SOM in Fig.3blargely comprises both, the blue and red clusters from the comparisons shown in Fig. 3C-f.
