
Figure 5.
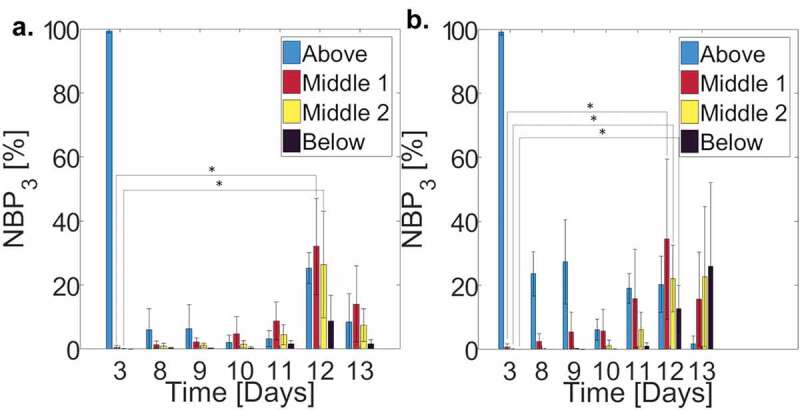
Average normalized bacterial count in each of the 4 SC regions, scaled by the total amount of bacteria on d 3 () for (a) control ( individual samples; cross-sections per sample) and (b) lipid depleted ( individual samples; cross-sections per sample) SC samples over a 10-d period. (Blue bars) Above the SC, (Red bars) upper half of SC, (Yellow bars) lower half of the SC, and (Black bars) below the SC. Error bars denote standard deviations.