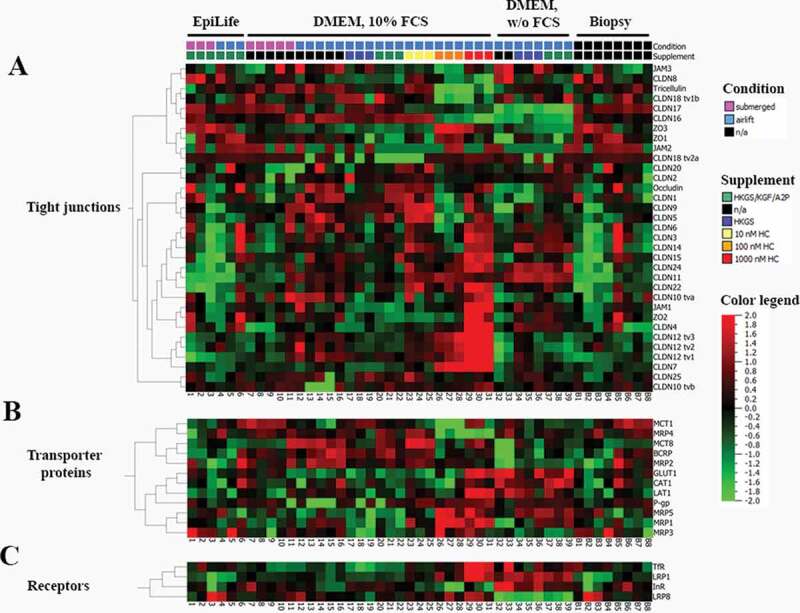
Figure 4.

Expression values of (A) tight junction proteins, (B) transporter proteins, and (C,) receptors of the High-Throughput qPCR Chip shown as ∆Ct values, referred to PPIA (peptidylprolyl isomerase A) as endogenous control. TR146 samples [Samples 1–39, 1–3: cultivated in EpiLife media (E3), submerged; 4–6: EpiLife (E3), airlift; 7–11: DMEM media, submerged; 12–16: DMEM media, airlift; 17–19: DMEM media supplemented with 1% HKGS, airlift; 20–22: DMEM media supplemented with HKGS/KGF/A2P, airlift; 23–25: DMEM media supplemented with 10 nM HC, airlift; 26–28: DMEM media supplemented with 100 nM HC, airlift: 29–31: DMEM media supplemented with 1000 nM HC, airlift: 32–33: DMEM media w/o serum, airlift; 34–36: DMEM media w/o serum supplemented with 1% HKGS, airlift: 36–39: DMEM media w/o serum supplemented with HKGS/KGF/A2P, airlift] plotted against 8 biopsy samples (B1-8) of the oral mucosa.
