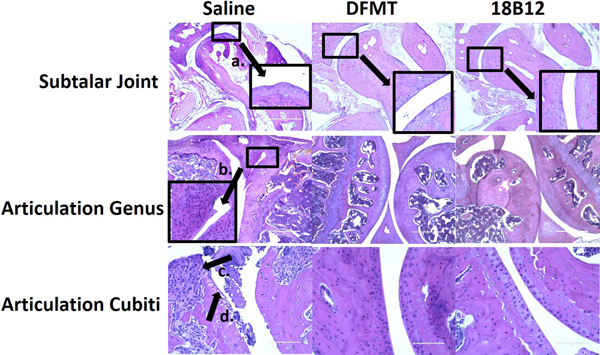
Figure 7.

Histological staining of mice joints. Joints from mice with average RA score of each treatment group were dissected, fixed and stained for imaging to evaluate bone erosion and loss. The scale bar in images of subtalar joint and articulation genus is 400 μm while in the images of articulation cubiti is 100 μm.
