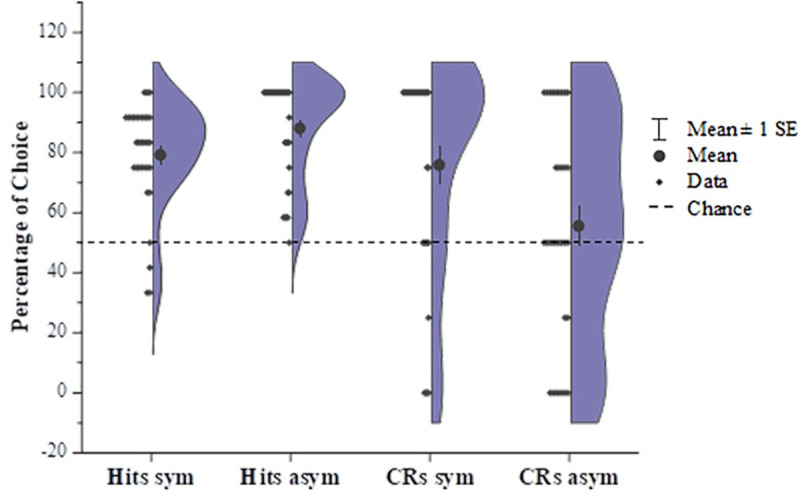
Fig 3. Correct recognition and rejection rates in the recognition test for experiment 1.

Half violin plots with data points on the other half show a kernel density estimate of the full distributions of the percentage of choices. Children who played with symmetric pictures had a significant correct rejection rate for the pictures that did not appear in the game, while children who played with asymmetric pictures could not correctly reject the pictures that they had not seen in the game compared with chance. Both groups of children correctly recognized the pictures they had played in the sticker game.
