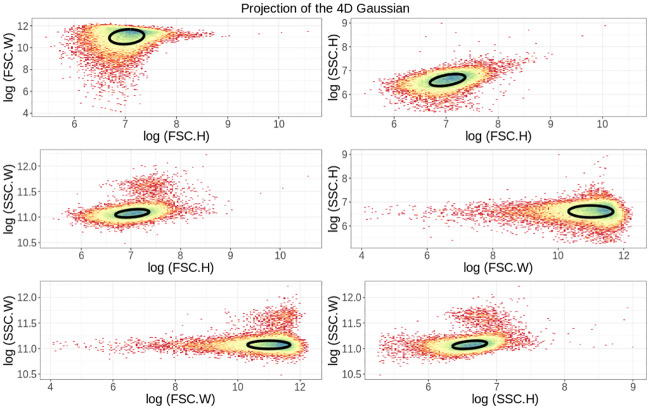
Fig 2. Mixture model fitting of the scatter signals.
The panels show different two-dimensional projections of the full 4D distribution of heights (H) and widths (W) of forward- (FSC) and side-scatter (SSC) measurements for 5 × 10⁴ events obtained from E. coli cells growing in M9 minimal media with lactose. The ellipses show the contour of the fitted multivariate Gaussian distribution, one standard deviation away in each principal direction. Note that the color indicates the local density of points.

