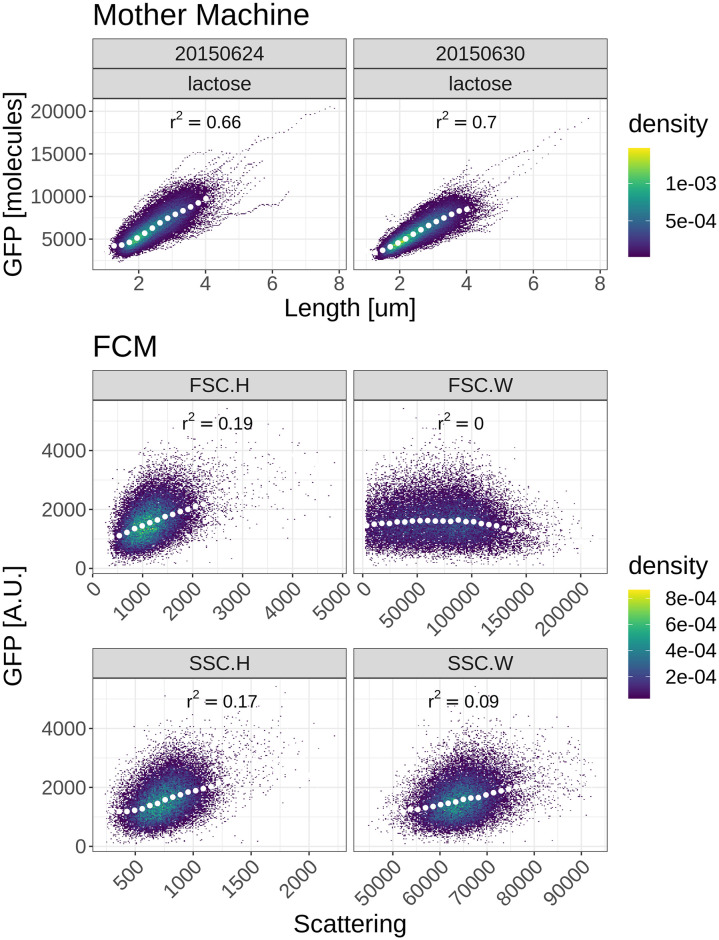
Fig 3. Correlation between cell size and fluorescence measurements for microscopy and cytometer measurements.
Each panel shows measured GFP fluorescence (vertical axis) and cell size estimates (horizontal axis) of cells growing in M9 minimal media with lactose. The top 2 panels show microscopy measurements from a microfluidic device [47]. The lower 4 panels show fluorescence measurements as a function of size estimates based on forward- (middle 2 panels) or side-scatter (bottom 2 panels) measurements in the flow cytometer (FCM). The squared Pearson correlations between fluorescence and size measurements are indicated in each panel. Note that the color indicates the density of points. The white dots show median values of equally spaced bins along the horizontal axis.

