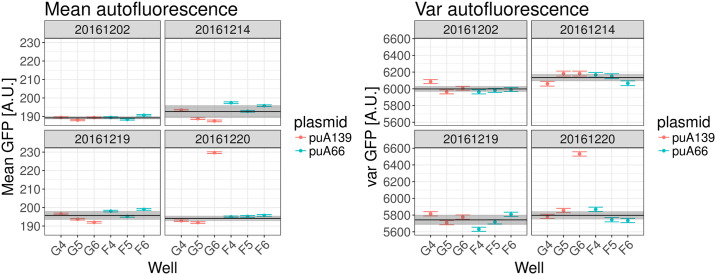
Fig 4. Autofluorescence measurements.
Each panel shows the measured mean fluorescence (left 4 panels) and variance in fluorescence (right 4 panels) on one day, with each bar indicating the measured value and error bar for one replicate. Two different strains were used (indicated in red and blue) and each was measured in triplicate on each day. The black line and grey bar indicate the estimated averages μd and corresponding error-bars σd for each day d. Note that well G6 on 20/12/2016 appears to be an outlier, possibly due to contamination of the well, which was excluded from the analysis.

