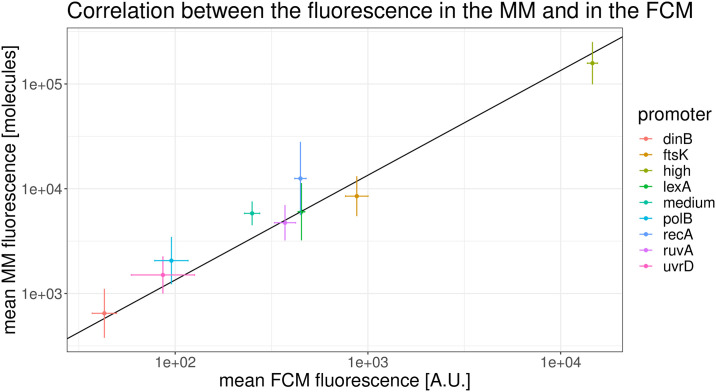
Fig 5. Estimated mean expression levels of different promoters as estimated by FCM and microscopy.
After correcting for autofluorescence, mean fluorescence levels of different promoters (colors) are perfectly linearly correlated between microscopy and FCM measurements, over the entire range of expression levels. The scales of the axes are in natural log and the error bars show the standard error of the mean. Note that the slope of the black line is 1.

