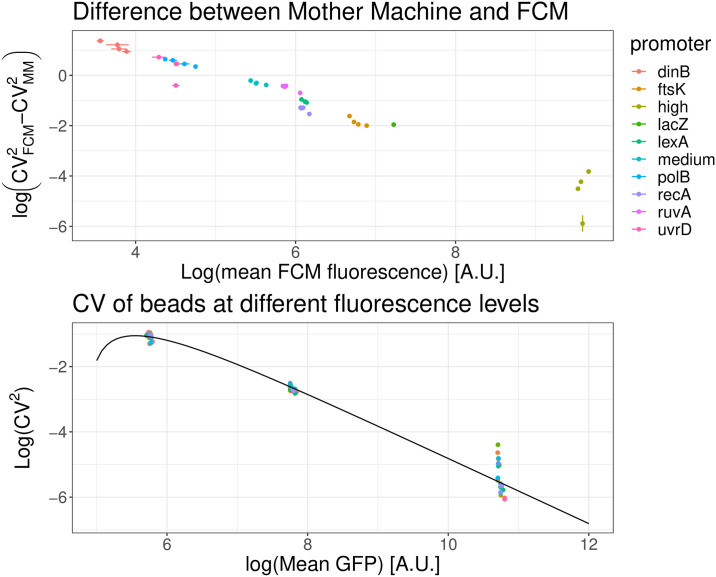
Fig 6. Difference in CV2 between the FCM and microscopy measurements shows FCM measurements contain substantial shot noise.
Top: Difference between the CV2 as measured by the FCM and the microscopy setup for different transcriptional reporters of E. coli promoters (colored points). Both axes are shown on a logarithmic scale. The difference in CV2 scales inversely with mean expression. Bottom: The observed CV2 of calibration beads of three different intensities also decreases as the inverse of mean intensity and this dependence can be well modeled by shot noise (black line), as given by Eq (3).

