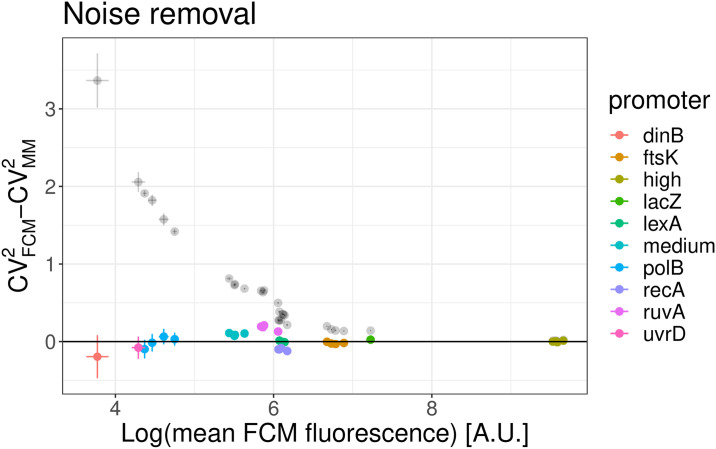
Fig 7. Comparison of CV2 from FCM and microscope measurements after correcting for autofluorescence and shot noise.
Absolute difference of the CV2 of different transcriptional reporters of native and synthetic E. coli promoters as estimated from FCM and microscope measurements. The black transparent dots use uncorrected FCM measurements and reproduce Fig 6 in linear scale, while the colored dots are obtained when using the CV2 that are corrected for the FCM shot noise.

