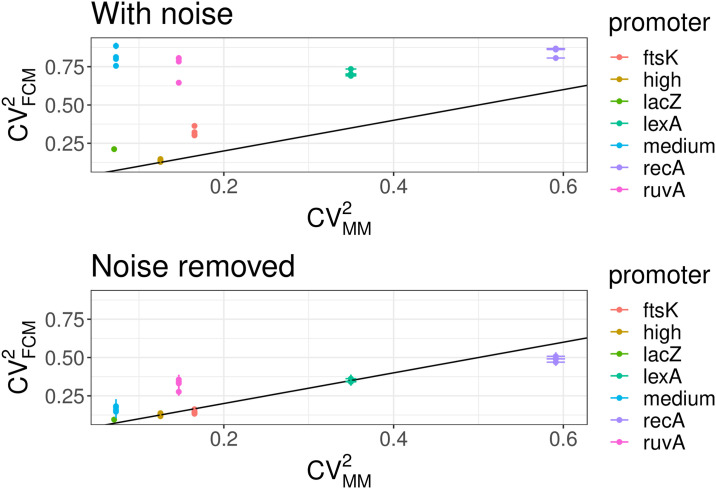
Fig 8. Correlation of CV2 in the FCM and microscope measurements before and after correcting for autofluorescence and shot noise.
Top: The CV2 of the raw FCM fluorescence measurements is consistently higher than the CV2 of fluorescence in the microscope measurements, and there is little correlation between the two. Bottom: Once the FCM measurements are corrected for autofluorescence and shot noise, there is now a good agreement between the CV2 as estimated by FCM and microscopy. Measurements for different promoters are indicated by different colors (see legend) and different points of the same color represent replicate FCM measurements. Only promoters expressing more than exp(4) above the background are shown and the black line in both plots is a line with slope 1 and intercept 0.

