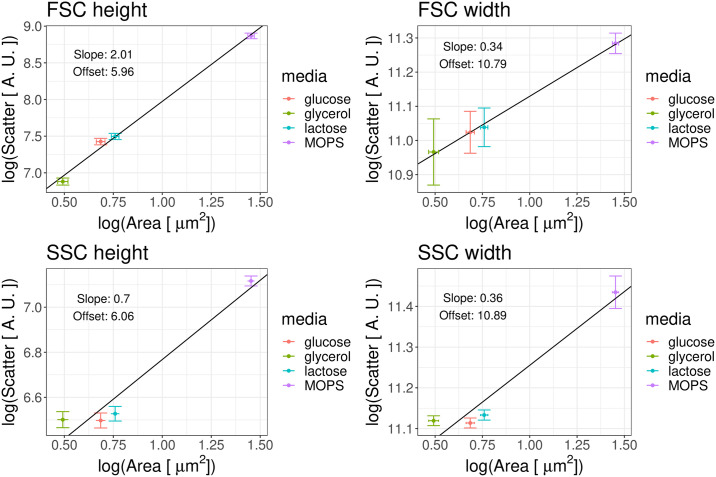
Fig 9. Average forward- and side-scatter of cells show approximate power-law dependence on average cell size.
Each panels shows the average of the logarithm of one of the four scattering signals, i.e. height or width of either forward- (FSC) or side-scatter (SSC), as a function of the average logarithm of cell area for E. coli cells growing in different media (M9 + glucose, glycerol or lactose; MOPS + glucose, see legend) as measured by microscopy [31]. The error bars represent the standard errors of the mean over replicate experiments.

