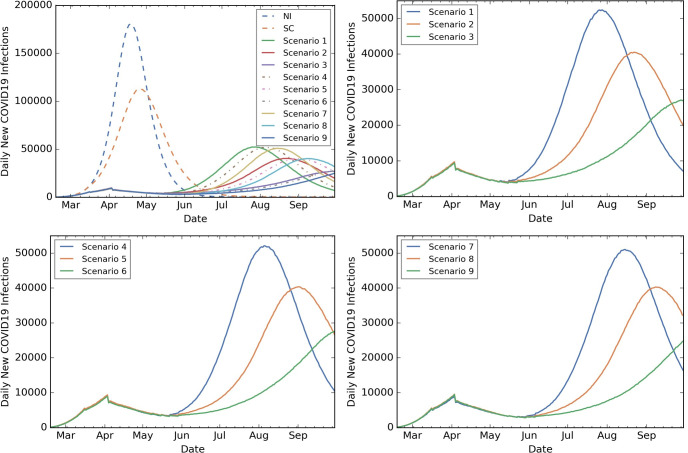
Fig 3. State level outcomes: NIC under all scenarios; 4-week, 5-week and 6-week SIP scenarios.
NIC under all scenarios including baseline (top left plot), NIC under 4-week SIP followed by Low (Scenario 1), Medium (Scenario 2), High (Scenario 3) VQ compliance (top right plot), NIC under 5-week SIP followed by Low (Scenario 4), Medium (Scenario 5), High (Scenario 6) VQ compliance (bottom left plot), NIC under 6-week SIP followed by Low (Scenario 7), Medium (Scenario 8), High (Scenario 9) VQ compliance (bottom right plot).

