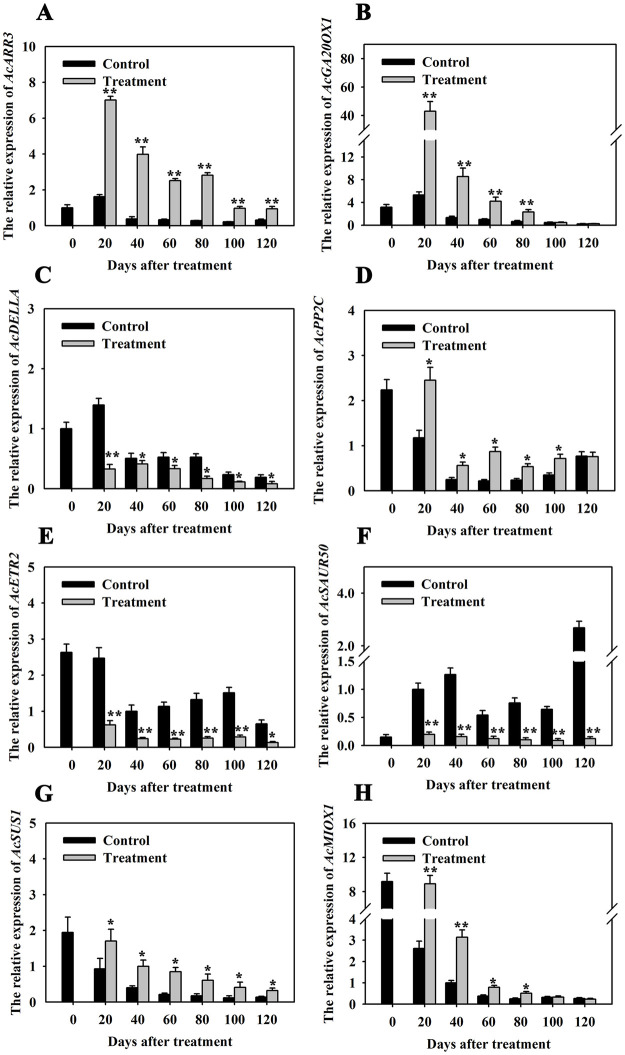
Fig 5. Expression patterns of 8 candidate genes in kiwifruits after CPPU treatment.
For all results, three technical replicates were performed, and all data represent the mean with standard deviations (n = 3), and 0 d, 20 d, 40 d, 60 d, 80 d, 100 d, and 120 d (days) mean the time points after CPPU treatments. Asterisks indicate significant difference, * and ** mean p < 0.05 and p < 0.01, respectively.

