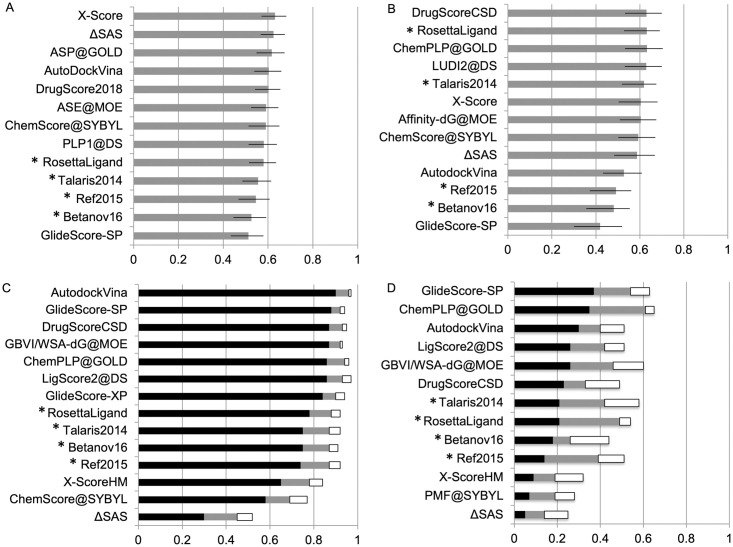
Fig 2. Results of Rosetta score functions and other reported software in CASF-2016.
(A) Pearson correlation in scoring test. (B) average Spearman correlation in ranking test. (C) Docking test with percentage of complexes where native pose within top 1%, 2% and 3% shown in black, gray and white, respectively. (D) Forward-screening test with percentage of complexes scoring known binder in top 1%, 5% and 10% shown in black, gray and white, respectively. Confidence intervals shown in (A) and (B). For simplicity, only the top performing score function from each external program is presented here.

