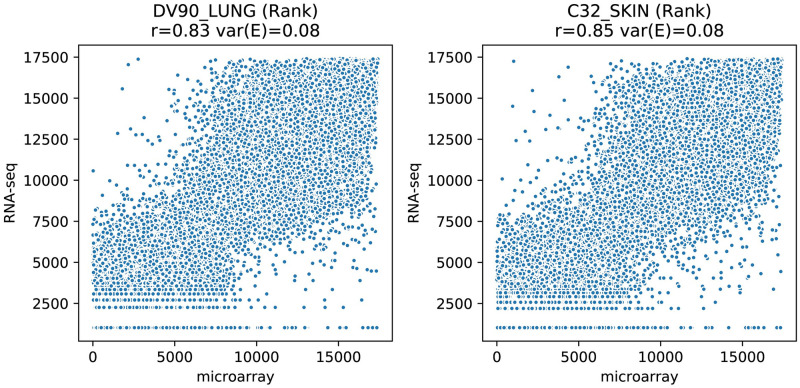
Fig 8. Comparison between ranked gene expression scores as established by microarray and RNA-Seq (from CCLE, dataset 1).
The samples are identical to the samples shown in Figs 3 and 4. Because the quantitative values for many genes is equal in RNA-seq they are assigned the same rank which causes the horizontal lines in the plot.

