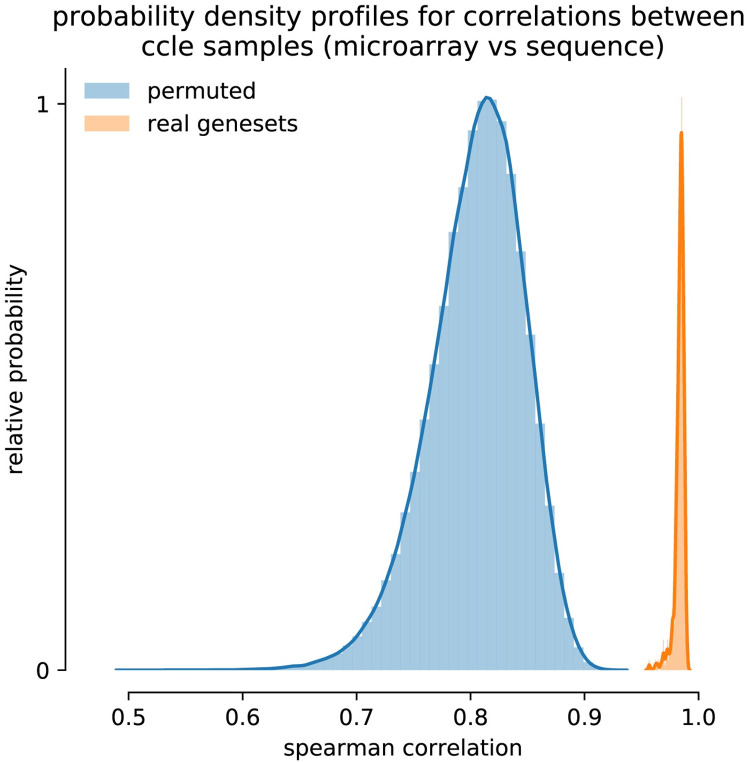
Fig 9. Obtained spearman correlations between the two enrichment score vectors computed for every sample with the RNA-Seq and microarray data.
The blue histogram (left) shows the results after permuting the gene set (mean correlation = 0.804). The orange histogram (right) represents results obtained with original gene set collection (mean correlation = 0.982).

