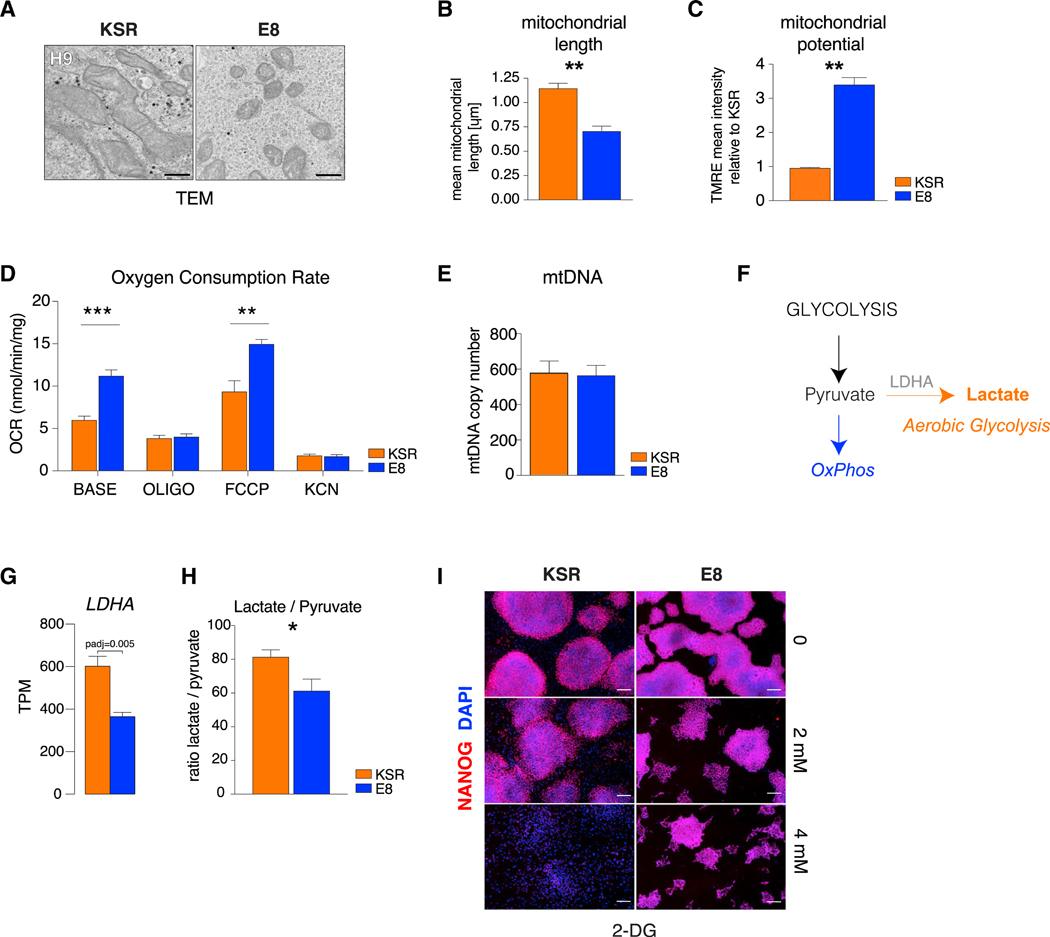
Figure 3. Naive Mitochondrial Morphology and Bioenergetics in E8 hPSCs.
(A) Transmission electron microscopy (TEM) of mitochondria in KSR and E8 hESCs (H9). Scale bars, 0.5 μm.
(B) Quantification of mitochondrial length in KSR and E8 hESCs.
(C) Quantification of mitochondrial potential in KSR and E8 hESCs by TMRE relative to average KSR.
(D) Quantification of oxygen consumption rate (OCR) in untreated KSR and E8 hESCs (base) in response to oligomycin (oligo), FCCP, and potassium cyanide (KCN).
(E) mtDNA copy number ratio to nuclear DNA in KSR and E8 hESCs.
(F) Scheme of alternative energy production pathways.
(G) Expression (RNA-seq) of LDHA in KSR and E8 (padj determined by DESeq2). Mean ± SEM (H9, HUES6, and MEL1).
(H) Ratio of intracellular lactate to pyruvate in KSR versus E8 hESCs. Mean ± SEM (H9, HUES6, and MEL1).
(I) Immunofluorescence of NANOG in KSR and E8 hESCs (H9) after 5-day treatment with 0, 2 mM, or 4 mM 2-deoxyglucose (2-DG). Scale bars, 200 μm.
Two-tailed t test; *p < 0.05, **p < 0.01, ***p < 0.001.

