
Figure 4.
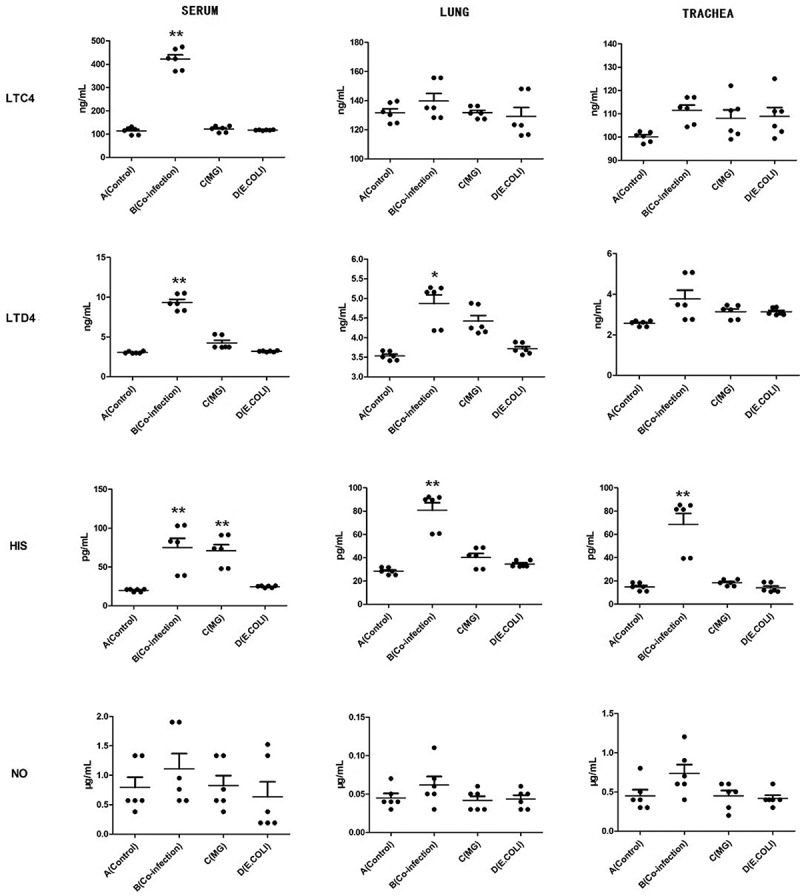
LTC4, LTD4, HIS, NO were detected by ELISA in serum, lung and tracheal tissues and performed with scatter plot. Bars represent the mean ± SD. The values with star differ significantly (with “*”, 0.01 < P < 0.05) or very significantly (with “**”, P < 0.01) between Group A and B.