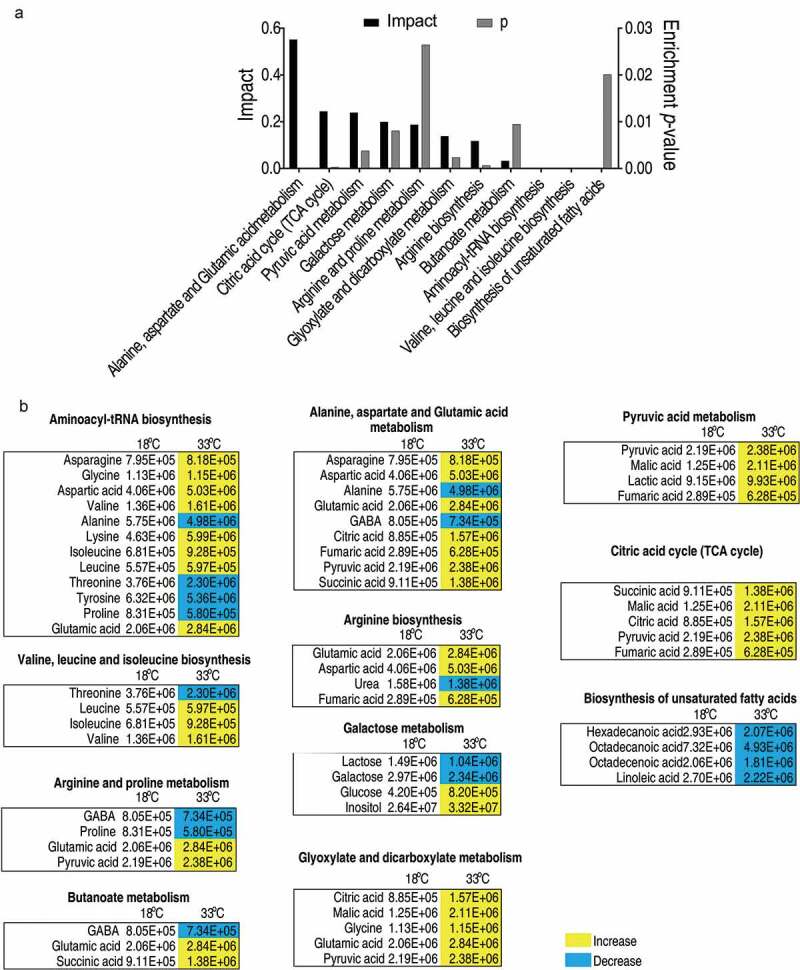
Figure 3.

Pathway analysis of differential metabolites.
(a) Pathway enrichment analysis of differential metabolites. Significantly enriched pathways are selected to plot (p value<0.05), and their impact was indicated. (b) The relative abundance of metabolites of each pathway listed in (a). Metabolites highlighted with yellow and blue indicate the increased and decreased abundance, respectively.
