
Figure 5.
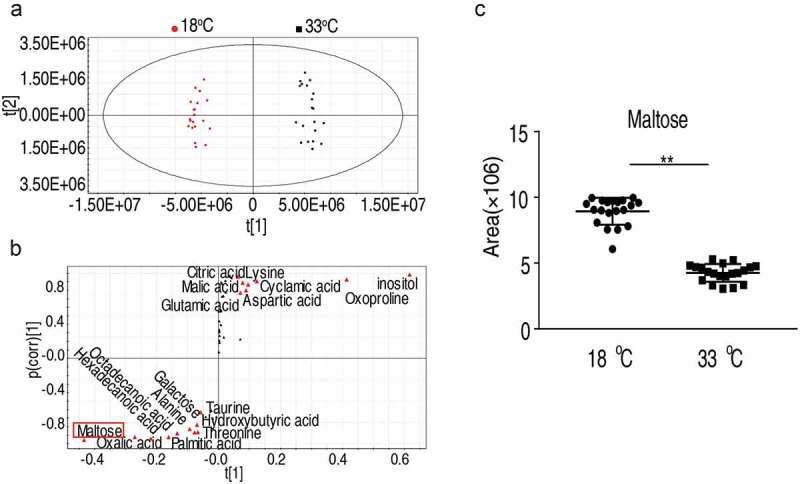
Maltose promotes fish survival against A. sobrial infection.
(a) The PCA analysis of metabolomic profiling of sample from fish grown at 33°C and 18°C. Each dot represents the technique replicates in the plot. (b) S-plot, generated by OPLS-DA, to identify differential metabolites of intragroup as from t [1] in (a). Each triangle represents individual metabolite, where potential biomarkers are highlighted with red, which is greater or equal to 0.05 and 0.5 for the absolute value of covariance p and correlation p (corr), respectively. (c) Maltose is a crucial biomarker that distinguishes the 33°C and 18°C as shown with dot-blot.