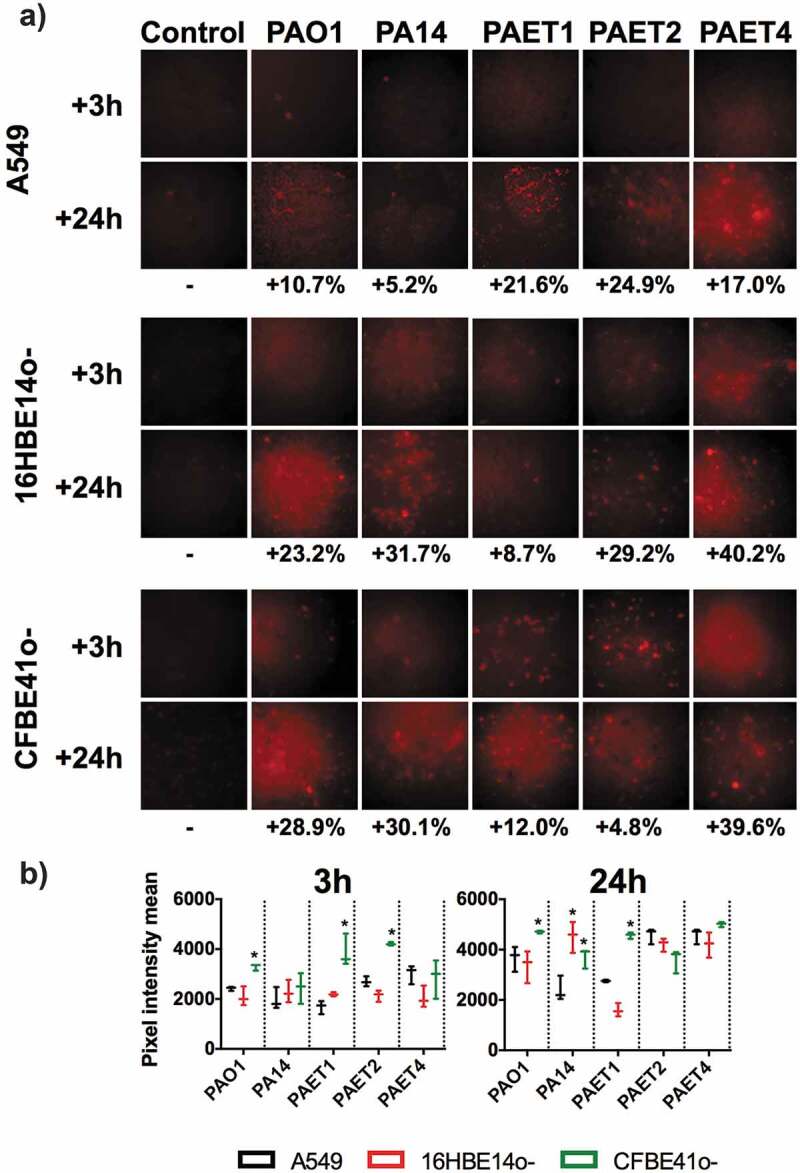
Figure 4.

Oxygen consumption of A549, 16HBE14o- and CFBE41o- P. aeruginosa-infected monolayers. A) Fluorescence microscope images showing the red fluorescence emission of the hypoxia probe dye after 3 and 24 h of initial infection of the PAO1, PA14, PAET1, PAET2 and PAET4 strains. Uninfected A549, 16HBE14o- and CFBE41o- were also included as controls. The red-intensity signal relates to cellular hypoxia. The percentage of red intensity increases from 3 h to 24 h of intracellular persistence per infection and lung epithelial cell type and is included in the figure. The percentages were calculated with ImageJ software using the pixel intensity averages from ten different images of each infectious condition and time-point. B) Graphs showing the pixel intensity averages and the respective standard error of the mean of each P. aeruginosa intracellular infection of A549, 16HBE14o- and CFBE41o- cells incubated for 3 and 24 h. Significance differences among lung cell infections with the same P. aeruginosa strains are denoted with asterisks (*) p > 0.05.
