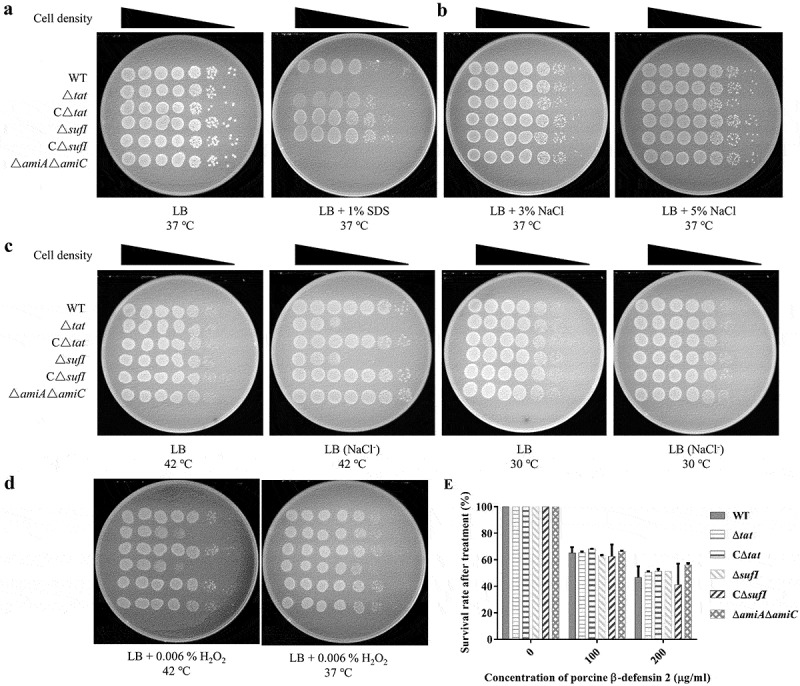
Figure 6.

Stress response assay. (a). SDS resistance.
Cells of WT, Δtat, CΔtat, ΔsufI, CΔsufI, and ΔamiAΔamiC strains at mid-log phase were serially diluted and 3 μL of each culture was spotted onto LB plate containing 2% SDS which were incubated at 37°C overnight. (b). High osmotic stress response. Cells of WT, Δtat, CΔtat, ΔsufI, CΔsufI, and ΔamiAΔamiC strains at mid-log phase were serially diluted and 3 μL of each culture was spotted onto LB plate containing 3% or 5% NaCl which were incubated at 37°C overnight. (c). Low osmotic and high-temperature stresses response. Cells of WT, Δtat, CΔtat, ΔsufI, CΔsufI, and ΔamiAΔamiC strains at mid-log phase were serially diluted, and 3 μL of each culture was spotted onto LB plate with or without NaCl which were incubated at 30°C or 42°C overnight. (d). Oxidized stress response. Cells of WT, Δtat, CΔtat, ΔsufI, CΔsufI, and ΔamiAΔamiC strains at mid-log phase were serially diluted and mixed with 0.006% H2O2, and 3 μL of each culture was spotted onto LB plate with or without NaCl which were incubated at 30°C or 42°C overnight. E. Antimicrobial peptide resistance. 5 × 10³ CFU of cells of WT, Δtat, CΔtat, ΔsufI, CΔsufI, and ΔamiAΔamiC strains at mid-log phase were mixed with different concentrations of synthetic porcine β defensin at 37°C for 1 hour, and the samples were plated onto LB plates and the viable cells were counted. The assay was performed in triplicate.
