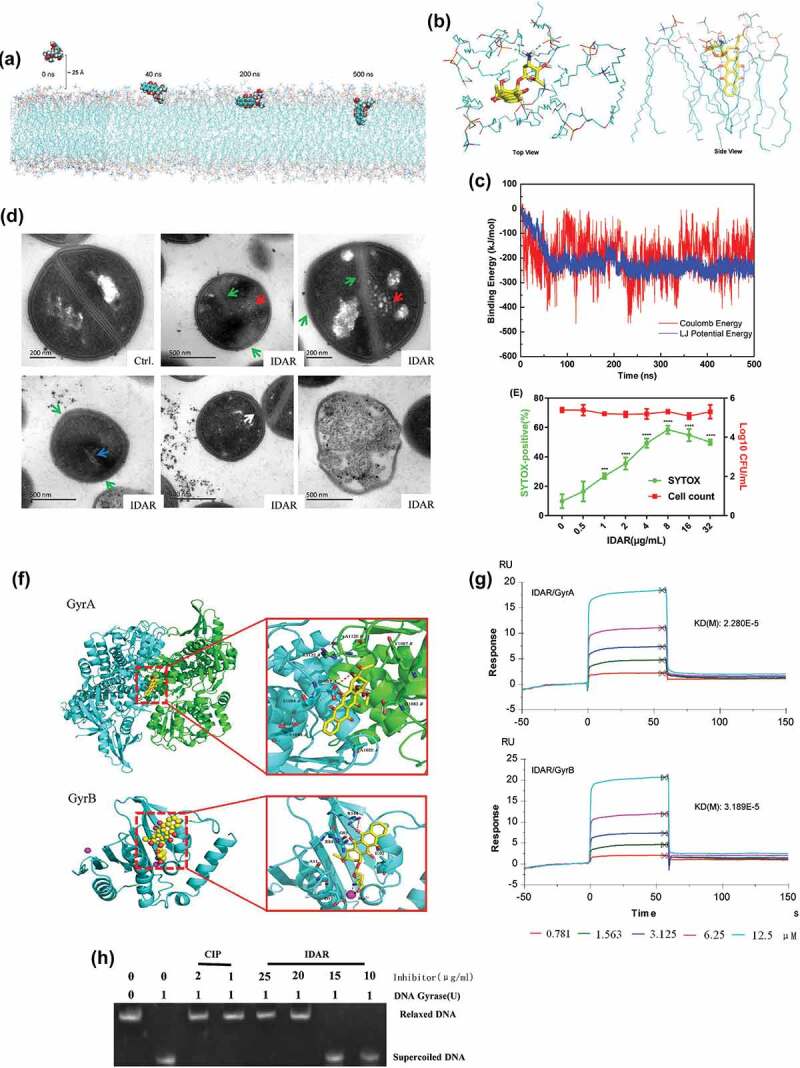
Figure 3.

IDAR disrupted the cell membrane and interacted with the DNA Topo IIA subunits GyrA and GyrB. (a) Representative configurations of MD simulations of IDAR from left to right: onset, membrane attachment, membrane penetration, and equilibrium interaction with 7DOPC/3DOPG lipid bilayers. (b) Interaction model between IDAR and phospholipid groups. (c) The free-energy profiles of IDAR penetrating into the indicated lipid bilayers as a function of the interaction time with the bilayer. (d) TEM showing mesosome-like structures (red arrow), cell wall disruption (green arrow), abnormal intracellular aggregation (blue arrow), cell membrane disruption (white arrow), and cell lysis in 5 × MIC IDAR-treated cells and DMSO controls. (e) Uptake of SYTOX Green (green line) and viable cell counts (red line) by exponential-phase S. aureus ATCC 43300 cells treated with IDAR. (f) Model of the interaction between IDAR and GyrA and GyrB by molecular docking analysis. (g) Affinity between IDAR and the GyrA and GyrB proteins by SPR analysis. (h) Inhibition of S. aureus gyrase activity by CIP and IDAR.
