
Figure 1.
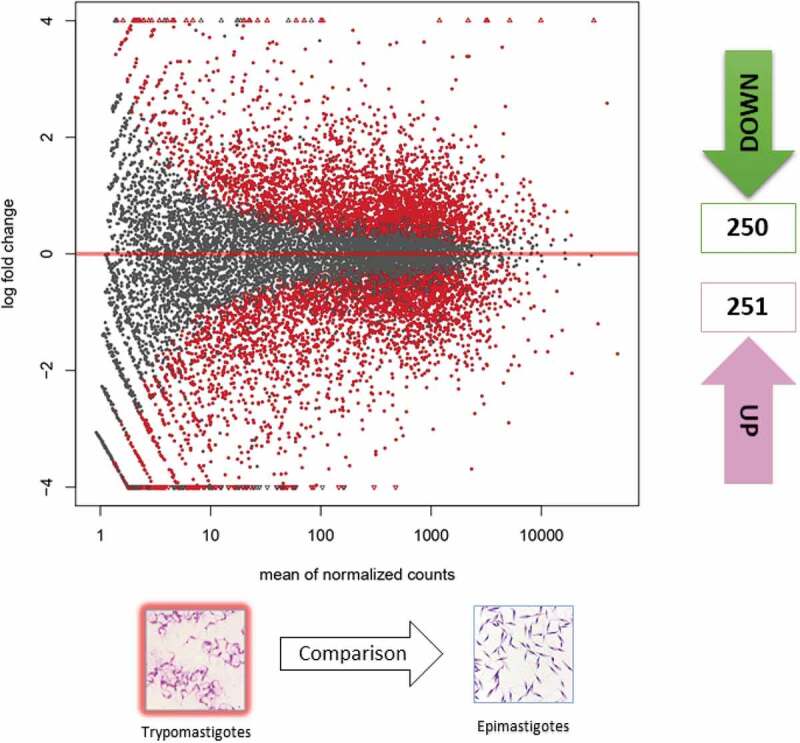
Gene expression of epimastigotes and metacyclic trypomastigotes. Volcano matrix to compare differentially expressed genes (DEGs) between metacyclic trypomastigotes (MTs) and epimastigotes (EPs), indicating the total number of down- and upregulated DEGs in metacyclic trypomastigotes.