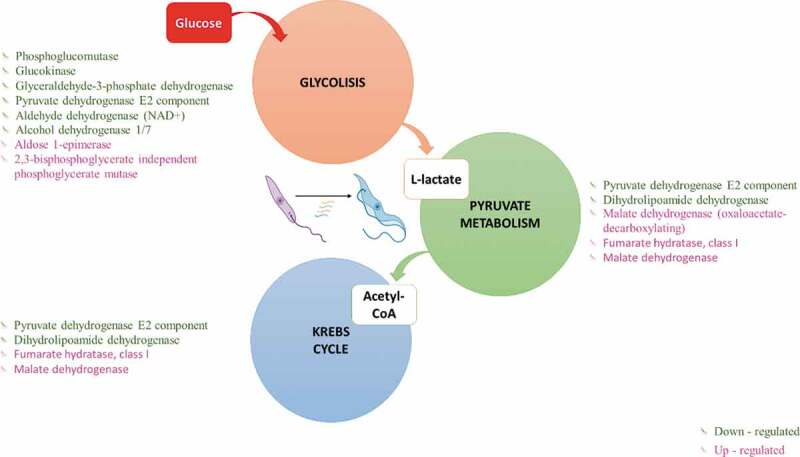
Figure 3.

Glucose energy processes. Differentially expressed genes (DEGs) in Metacyclic trypomastigotes in comparison with epimastigotes in the metabolism of glycolysis, pyruvate, and the Krebs cycle (downregulated genes in green and upregulated genes in pink).
