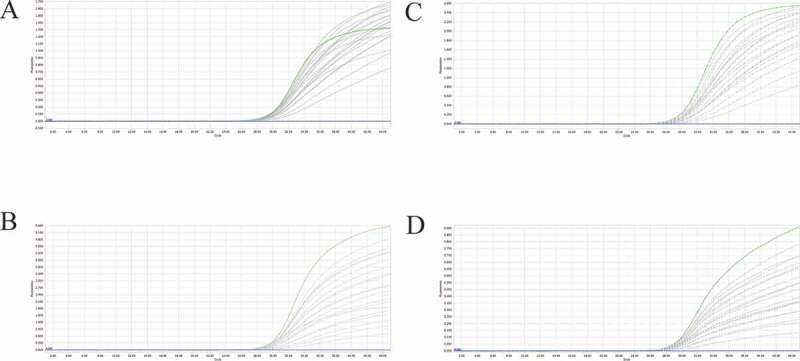
Figure 2.

A-D: amplification curves (X-axis: Cycle, Y-axis: Fluorescence) of PEDV, PDCoV, PToV, and SADS-CoV detected by multiplex real-time PCR with different probe and primer concentrations. Plasmid standards with concentration of 1 × 10³ copies/μL were chosen as templates for the reactions. The four green lines are the amplification curves of four fluorescence of the most suitable reaction tube.
