Figure 1.

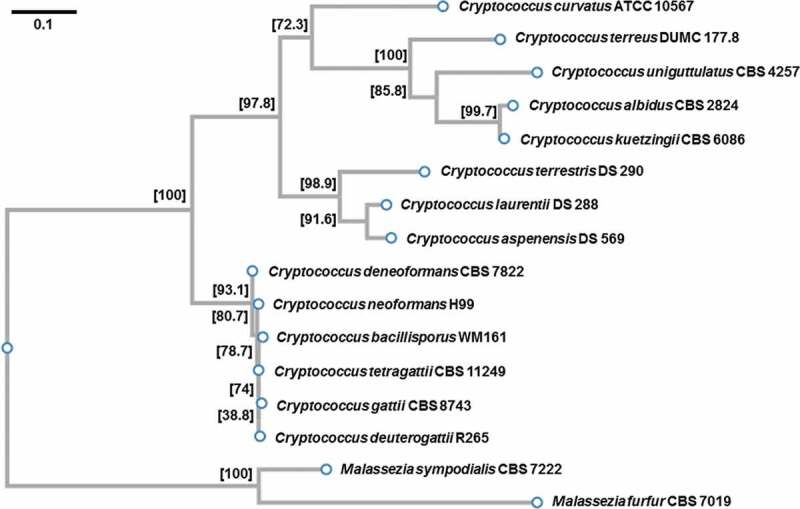
Phylogenetic tree illustrating the relatedness of the species included in this study. Values at nodes are SH-like local support. Scale bar indicates one substitution per 10 nucleotide positions.

Phylogenetic tree illustrating the relatedness of the species included in this study. Values at nodes are SH-like local support. Scale bar indicates one substitution per 10 nucleotide positions.