
Figure 4.
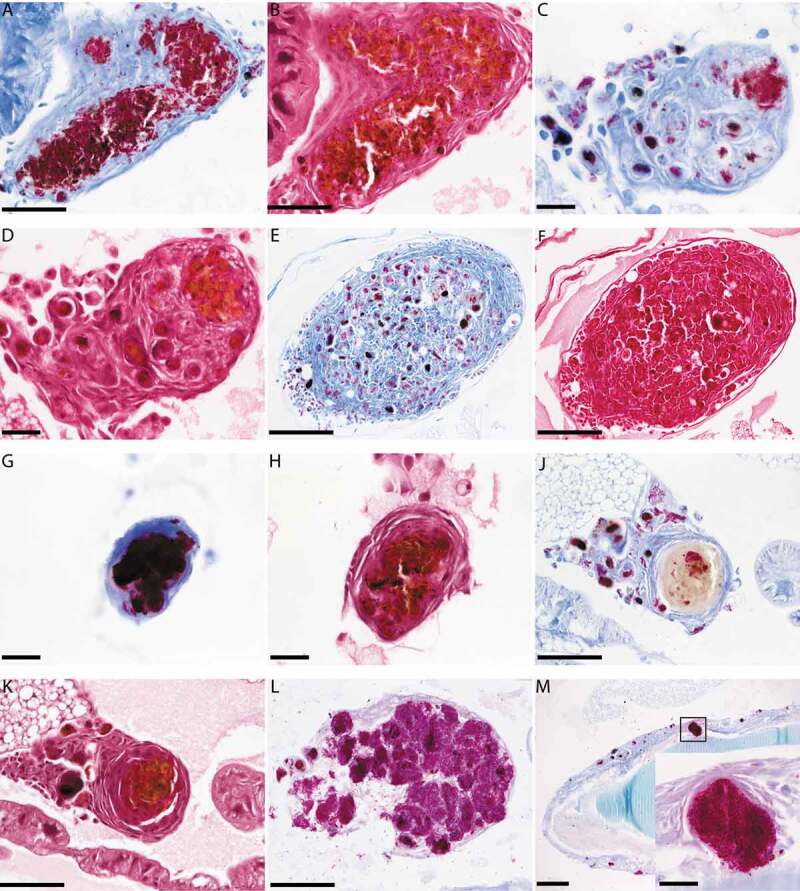
Histological analysis of G. mellonella-SAMTB lux interaction over time.
Histological sections of G. mellonella infected with SAMTB lux stained with Ziehl-Neelsen (ZN) or hematoxylin and eosin (H&E). (A) At 24 h post infection, large numbers of individual and densely organized bacilli were stained with ZN. (B) The H&E section of the same granuloma-like structure shows host cells occupying spaces which, in the ZN section, are filled with bacilli. Loss of eosinophilia from the H&E section gives rise to a brown pigmentation which co-localizes with clumping of bacilli in the ZN section. (C) As early as 24 h post-infection, granuloma-like structures may contain independent colonies of bacilli and compact ZN reactive amorphous material. (D) The H&E section of the same structure shown in C; loss of eosinophilia coincides with the existence of a large colony of bacilli. (E-F) At 168 h post-infection, granuloma-like structures containing compact ZN positive substances and individual bacilli or colonies of bacilli, were observed. At 48 h post-infection, (G) ZN and (H) H&E staining, show a single compact granuloma with a ZN reactive core. Such granuloma-like structures can be observed as single entities or can be included in formations that include multiple compact ZN positive structures similar to panels C-F. (J-K) Granuloma-like structure at 168 h post-infection, stained with ZN and H&E respectively, shows a single compact granuloma structure. However, the ZN affiliation of the amorphous central core has been abolished to a large extend implying breakdown of the structures that bind to the ZN dye. (L) Swarms of ZN positive bacilli form a granuloma-like structure. Part of the granuloma wall is impaired allowing access of bacteria to the surrounding hemolymph. (M) shows bacilli invading and forming colonies in internal organs of a larva. There is no evident host reaction to invading bacilli. The inset shows a larger magnification of the rectangle enclosed structure which shows abundant proliferation of bacilli. Scale bar in A, B, J, K and L represents 50 µm; in C, D, G, H and the M inset, scale bar represents 20 µm; while in E, F and M the scale bar represents 100 µm.