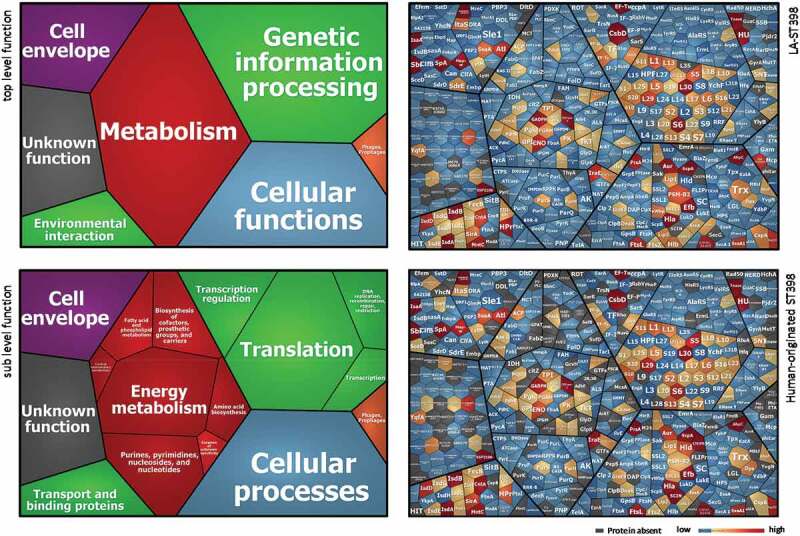
Figure 3.

Functional categories and relative abundance of identified extracellular proteins from the investigated LA-ST398 and human-originated ST398 S. aureus strain. Voronoi treemaps in the panels on the left show the “top level functions” (TIGRfam level 1) and “sub level functions” (TIGRfam level 2). The different functional categories are marked in different colors, and the size of each functional category is proportional to the number of identified proteins with the respective function. Voronoi treemaps on the right represent the relative abundance of individual extracellular proteins from LA-ST398 strains (top-right panel) or human-originated ST398 strains (bottom-right panel). Each protein is represented by a polygon-shaped tile and its relative average protein abundance is indicated in color code.
