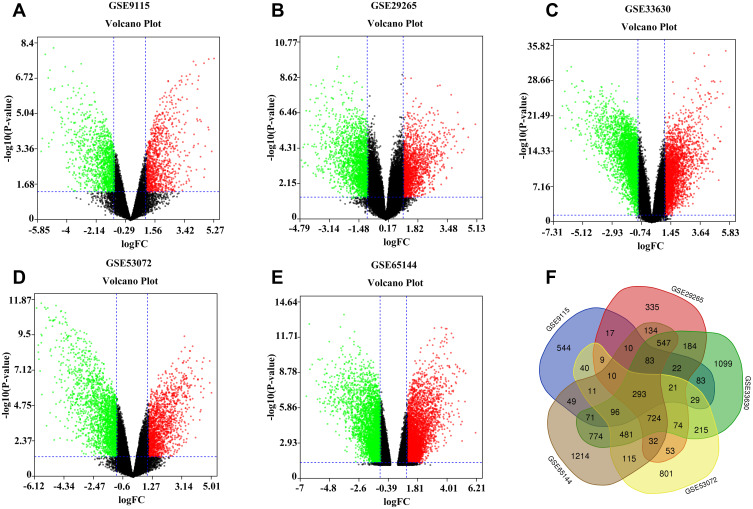
Figure 1.
Volcano plot of gene expression profile data in ATC and normal samples. (A) Volcano plot of GSE9115, (B) Volcano plot of GSE29265, (C) Volcano plot of GSE33630, (D) Volcano plot of GSE53072, and (E) Volcano plot of GSE65144. The red color represents the upregulation, and the green color represents the downregulation. (F) Venn diagram of the overlapping DEGs.

